
The GB10 has been running a 120B model as an always-on agent for a few weeks now. That setup is headless on purpose. Telegram in, model out, no browser involved.
I wanted a proper chat interface on the same hardware. I also wanted it managed by NVIDIA AI Workbench instead of a hand-written docker run line, so the whole thing would be reproducible.
I found three different problems. Fixing the first one allowed the second one to appear, and fixing the second exposed the third. I have kept them in the order I found them.
1. A capital letter
The first failure was a container that never started. Workbench showed this:
| |
That is the whole message. No container ID, no exit code, no service name. No container was ever created. It fails at Compose config load, before anything gets scheduled, so there is nothing to report on.
The actual cause, from the daemon side:
| |
My project is called Bervid. Capital B. Workbench hands the project’s meta.name to Compose exactly as written, and Compose has required lowercase project names since v2. That was all it was.
Why the command-line test passed
I could not reproduce the error with the commands I first used:
| |
The CLI takes the project name from the working directory and normalises it silently. Bervid becomes bervid and everything works. Workbench sets the name explicitly, passing it in as given, so it never gets normalised.
Every shell test passed because the CLI removed the capital letter before Compose checked the name. Workbench did not. My command-line test therefore did not cover the code path that failed.
I have written before about checks that answer a narrower question than the one you asked. This is the same shape, but sharper. My test environment differed from the real one in exactly the thing I was testing.
What does not fix it
Adding a top-level name to compose.yaml looks like the obvious fix and does nothing:
| |
The file-level name: is only a default. A project name passed in explicitly beats it, and Workbench always passes one. So you can set this, watch it get ignored, and reasonably decide the project name is not the problem. That is a second trap sitting right on top of the first.
The name has to change where Workbench reads it:
.project/spec.yaml, the project’smeta.name~/.nvwb/inventory.json, Workbench’s own cache of it
Miss the second one and the old name comes back.
The GPU badge
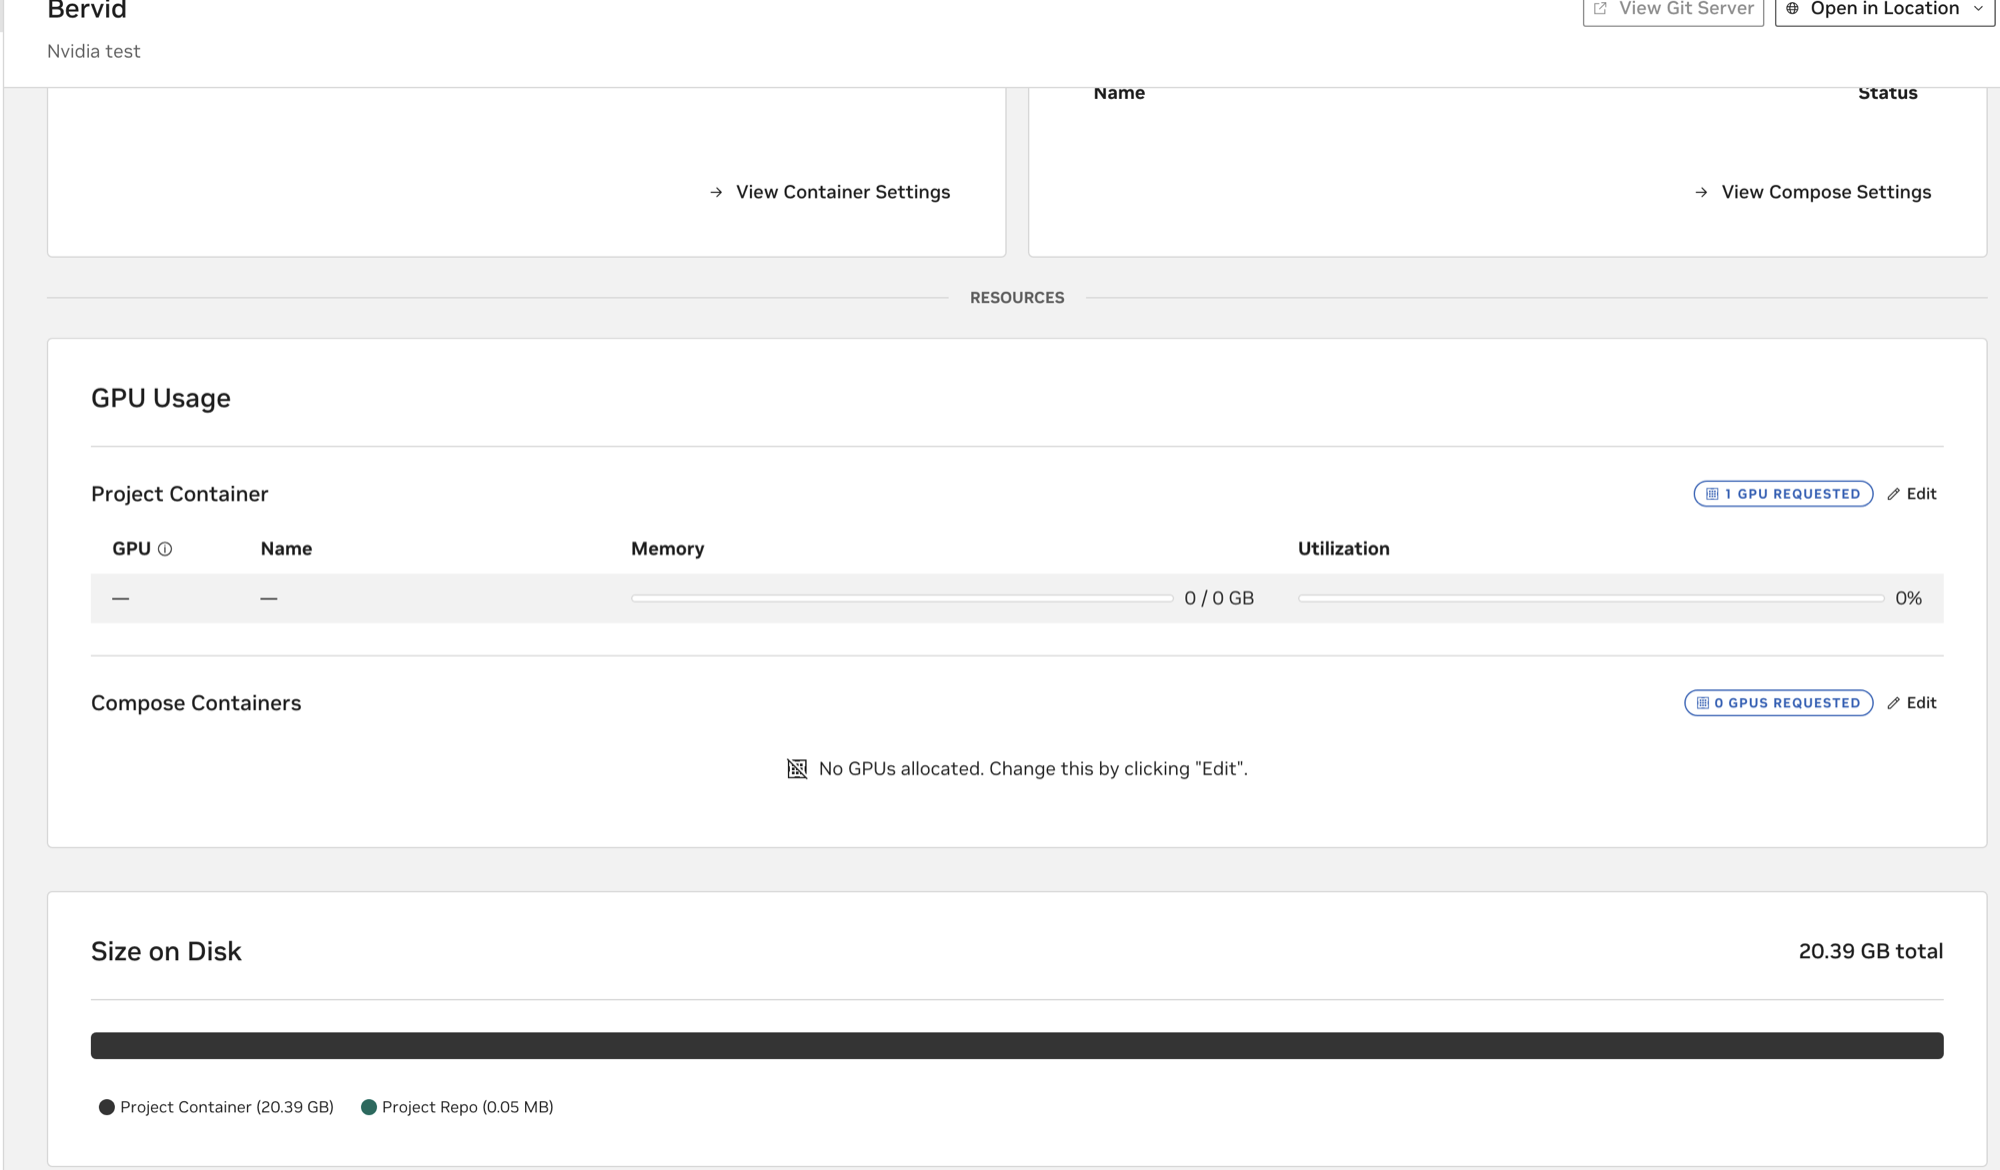
The project page had been showing this the whole time:
| |
I assumed this was a cosmetic UI problem because it did not look related to the failed container. I was wrong. Workbench could not parse the Compose file, so it could not read the GPU allocation either.
It was the same failure. The panel was actually erroring with resources.assignedGPUs could not load compose file. Workbench draws that badge by parsing the Compose config, the config was not parsing, so it showed zero. A GPU allocation I had already written into the file had never once been used.
Here is what makes it worth a section. After the name fix, the badge still read 0 GPUS REQUESTED, and this time it really was cosmetic, for a completely different reason.
The GPU was attached and working. docker inspect showed the device bound, nvidia-smi inside the container reported NVIDIA GB10, 12.1, and inference ran at 9.4 tok/s. But I had written the allocation as device_ids:
| |
Allocating by device_ids leaves Docker’s count field at zero. docker inspect gives back Count:0, DeviceIDs:["0"]. Workbench’s badge counts count. So it shows zero while a GPU is attached and busy.
Same badge, same zero, two unrelated causes:
| Cause | Actually broken? | |
|---|---|---|
| Before the name fix | compose file would not parse | yes |
| After the name fix | badge counts count, allocation used device_ids | no |
The fix moved it from one to the other without changing a single character of what it displayed. A status light that looks the same whether the file will not parse or the GPU is running at full load is not really a status light.
So my first reading was not exactly wrong. It was wrong when I made it and right afterwards, for reasons that had nothing to do with why I said it. Both were true at different times, and the UI never once showed which. That is the third example of this post’s whole point, and the only one I can show from both sides.
2. The volume that disappeared when I renamed the project
Fixing the name immediately produced a new error:
| |
Workbench injects its own shared volume into every Compose project. It is declared as external and named after the project:
| |
external: true means “this already exists, do not create it”. So renaming the project renamed the volume it was looking for, and pointed it at something that had never existed. The old volume was still on disk under the old name, orphaned.
This is a direct consequence of fixing bug 1, and it could not have appeared any earlier. You cannot get a volume error out of a config that never loads. Each fix was what let me see the next failure.
3. 19 GB that did not re-download
Same cause, much more expensive symptom. I caught this one before it happened, which is the only reason the number stayed hypothetical.
The NIM container caches model weights in a volume. When the project name changed, Compose did the sensible thing with a volume it cannot find. It got ready to make a fresh, empty one. The old cache was still on disk under the previous project’s name with 27.7 GB in it. Starting the container then would have pulled about 19 GB of weights that were already on the same SSD.
I noticed that the new volume was empty while the old one was not, and pinned the existing one before starting anything:
| |
So the honest version of this section is a near miss, not a disaster. I never actually watched it download.
Why it would have been hard to spot
The interesting part is what that failure would have looked like. It is not an error, and it is not “healthy” either.
An empty cache is just a cache miss. Nothing is wrong as far as any component is concerned, so nothing logs an error. But the container cannot report healthy while it pulls either, because the health check is the readiness endpoint:
| |
/v1/health/ready will not answer until the weights are loaded, so every probe fails while the download runs. Docker keeps the container in starting until either the first success or retries failures in a row. It never passes through healthy at all.
What you would actually see is a container sitting in starting for twenty to sixty minutes, throwing no errors, looking exactly like one that is stuck.
That is why retries: 240 is what it is. 240 × 15 s is exactly 3600 s, and the CLI wrapper’s READY_TIMEOUT went from 900 to 3600 for the same reason. A 15-minute timeout was calling a perfectly normal download a failure. The message was reworded to say the container is still downloading rather than that it had died.
It is worth noticing what the fix was. A bigger number and an honest message, not a code change. There was no bug to fix. “Still working” and “hung” really are indistinguishable from outside when your only signal is an endpoint that stays quiet until it is done. The best you can do is stop calling it a failure so early.
Open WebUI cannot live under a path prefix
This is a separate problem, and it gets its own section because the symptom is so useless. A blank page. Not a 404, not an error, not a stack trace. HTTP 200, correct HTML, nothing on screen.
Workbench wants to serve applications through a reverse proxy on a path prefix. Open WebUI is a SvelteKit single-page app, and it emits root-absolute asset URLs like /_app/immutable/..., with no base path you can set at runtime.
Two requests show it:
| Request | Through the proxy prefix | At the proxy root |
|---|---|---|
| The HTML document | 200 | — |
/_app/immutable/entry/start.*.js | 200 | 404 |
The browser fetches the document fine through the prefix. Then it reads an asset URL rooted at /, asks for it without the prefix, and gets a 404. No JavaScript loads, so nothing renders and nothing complains. You are left with a valid empty shell waiting for a bundle that never arrives.
That is structural, not a misconfiguration. The Workbench “open in browser” link can never work for Open WebUI. Use the published port. I wasted time on this as a proxy-header problem, because “200 with a blank page” feels like a rendering bug rather than a routing one.
Use the published port instead and the bundle loads from the root it expects:
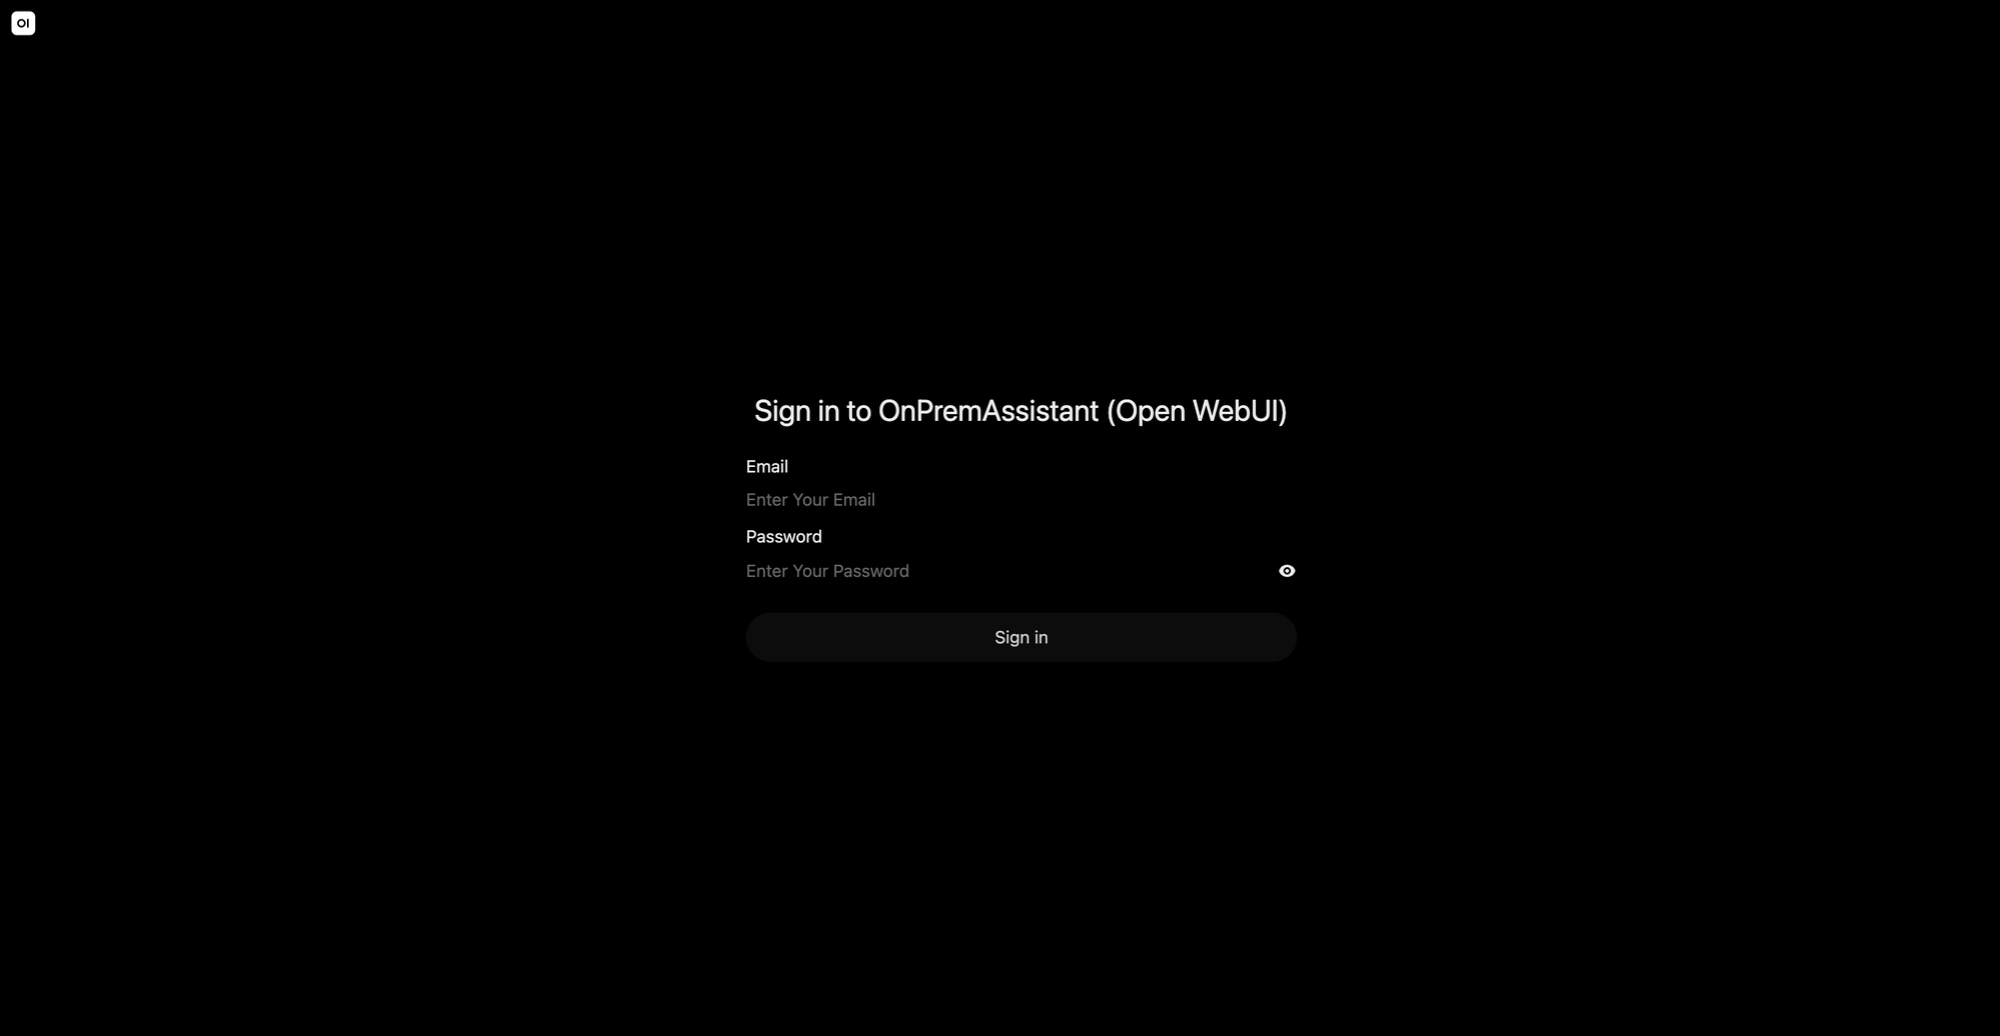
That login screen is a useful diagnostic in its own right. It is the first thing the JavaScript bundle draws, so if you can see it, the assets resolved. That tells you “the app is broken” versus “the app never loaded” in one look, with no developer tools needed.
But it is worth being careful about what that screen implies. I got this wrong in the first version of this post and only caught it by checking the running server.
In the original write-up I flagged that binding Ollama to 0.0.0.0 puts a GPU on the network with nothing in front of it. I assumed putting Open WebUI on top fixed that, since it has accounts and a proper admin surface:
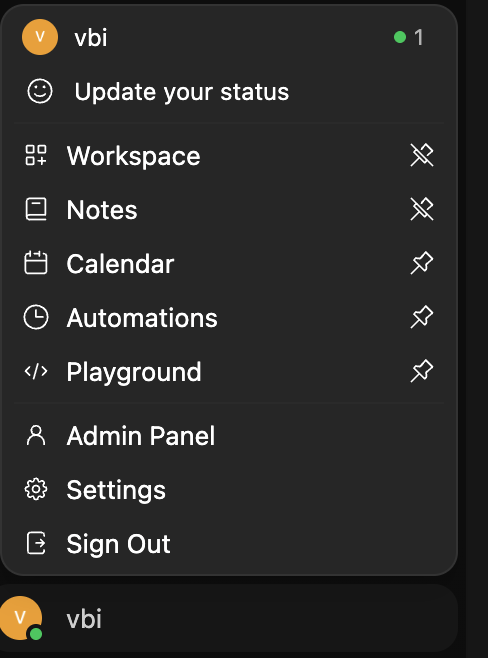
It does not, because of one line in the compose file:
| |
With that set there is no login. Open WebUI signs you in directly as an admin, and the server says so if you ask it:
| |
So the honest position is worse than I first wrote. Ollama on 11434 has no authentication, and neither does the interface in front of it. Anything that can reach either port has the box, with full chat access and the admin panel included.
Notice how little the UI tells you about this. The sign-in screen still exists in the bundle, enable_login_form is still true in the config, and my screenshot of it looks exactly like a protected deployment. A login page you were never shown is indistinguishable from one you already passed. The only reliable check is asking the server what it thinks its own auth setting is.
This is fine for a single-user box on a private tailnet, which is what that comment says it is for. It is not fine the moment anything else can route to it, and it is easy to forget precisely because the interface looks identical either way.
The auto-pin that was not in the application
With everything finally running, one thing made no sense. Models stayed in GPU memory forever, and the app’s “unpin” button never seemed to do anything.
I went looking for the pinning logic in the app. There is none. It was one line of host config:
| |
-1 means never unload. Set at the systemd level it applies to every model Ollama loads, not just the one you care about. I had set it deliberately. It is in the original GB10 write-up as the single most important config change, and for one always-warm 120B model it is exactly right.
It stops being right the moment there is a second model. Then it just hoards them.
Back to a real timeout:
| |
That handed back 10.9 GB immediately.
The bug underneath the bug
Fixing the host default exposed a bug in the app that had been invisible until then.
The UI worked out whether a model was pinned by asking something slightly different: is this model resident in memory right now? Under KEEP_ALIVE=-1 those two questions always have the same answer, for every model. Resident means pinned, because nothing ever unloads. The check was right, and it was right only because the host default hid the difference.
Give it a real idle timeout and the two come apart. A model can be resident and not pinned. Loaded, in use, and quite willing to unload itself in four minutes. So the UI was offering “Unpin” for models that were about to unpin themselves anyway.
What Ollama actually gives you is expires_at. Under the old default, every loaded model looked like this:
| |
Year 2318 is what “never” looks like. After going back to KEEP_ALIVE=5m, the same command gives a real clock time a few minutes out, refreshed on every request.
That is the whole test, and it is one field. Residency tells you the model is there. Only expires_at tells you whether it plans to stay. A model can look resident and be four minutes from disappearing, which is exactly the state the UI was calling “pinned”.
This is the same failure as the CLI reproduction at the top, reached from a completely different direction. A check gave the right answer for a long time, because the environment happened to make the wrong question equal to the right one. The moment the environment changed, it started lying without behaving any differently.
Where you can and cannot override this
Open WebUI gives you a long list of per-chat parameter overrides:
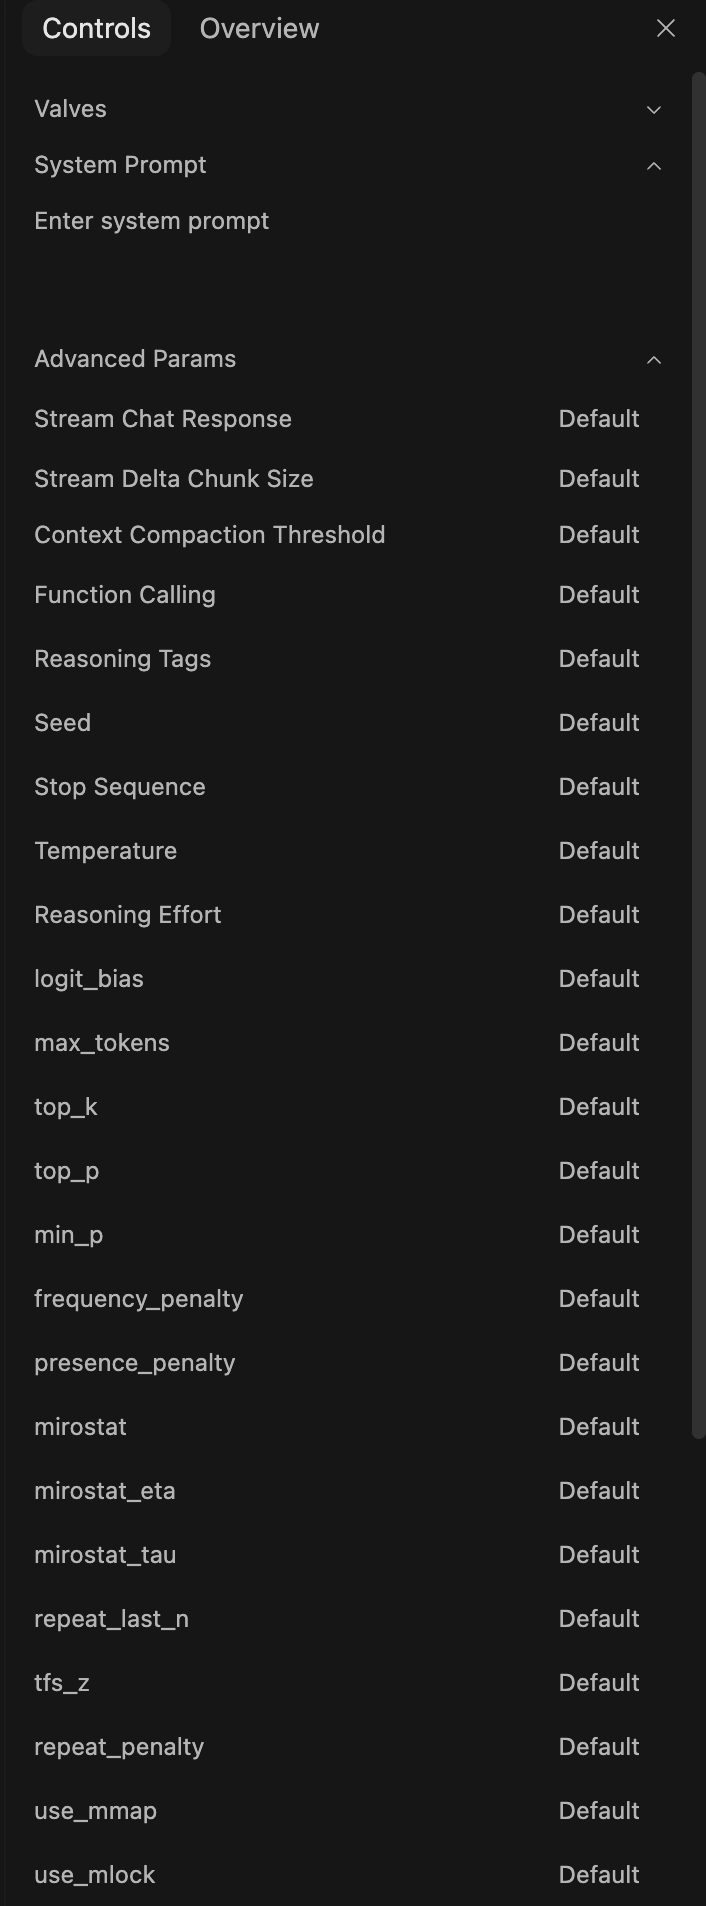
A few of them are Ollama memory options. use_mmap and use_mlock are at the bottom. They are tempting when a model is misbehaving around memory. They are not where the pinning lived.
Every value in that panel says Default, and that is the honest state. None of them was ever touched, and the residency behaviour came entirely from a systemd environment variable two layers below the app. A per-chat override cannot fix a host-level default, and digging through this panel is exactly the wrong-layer search I wasted time on.
Two models, one box
The whole point of this was to run more than one model at once, and it works.
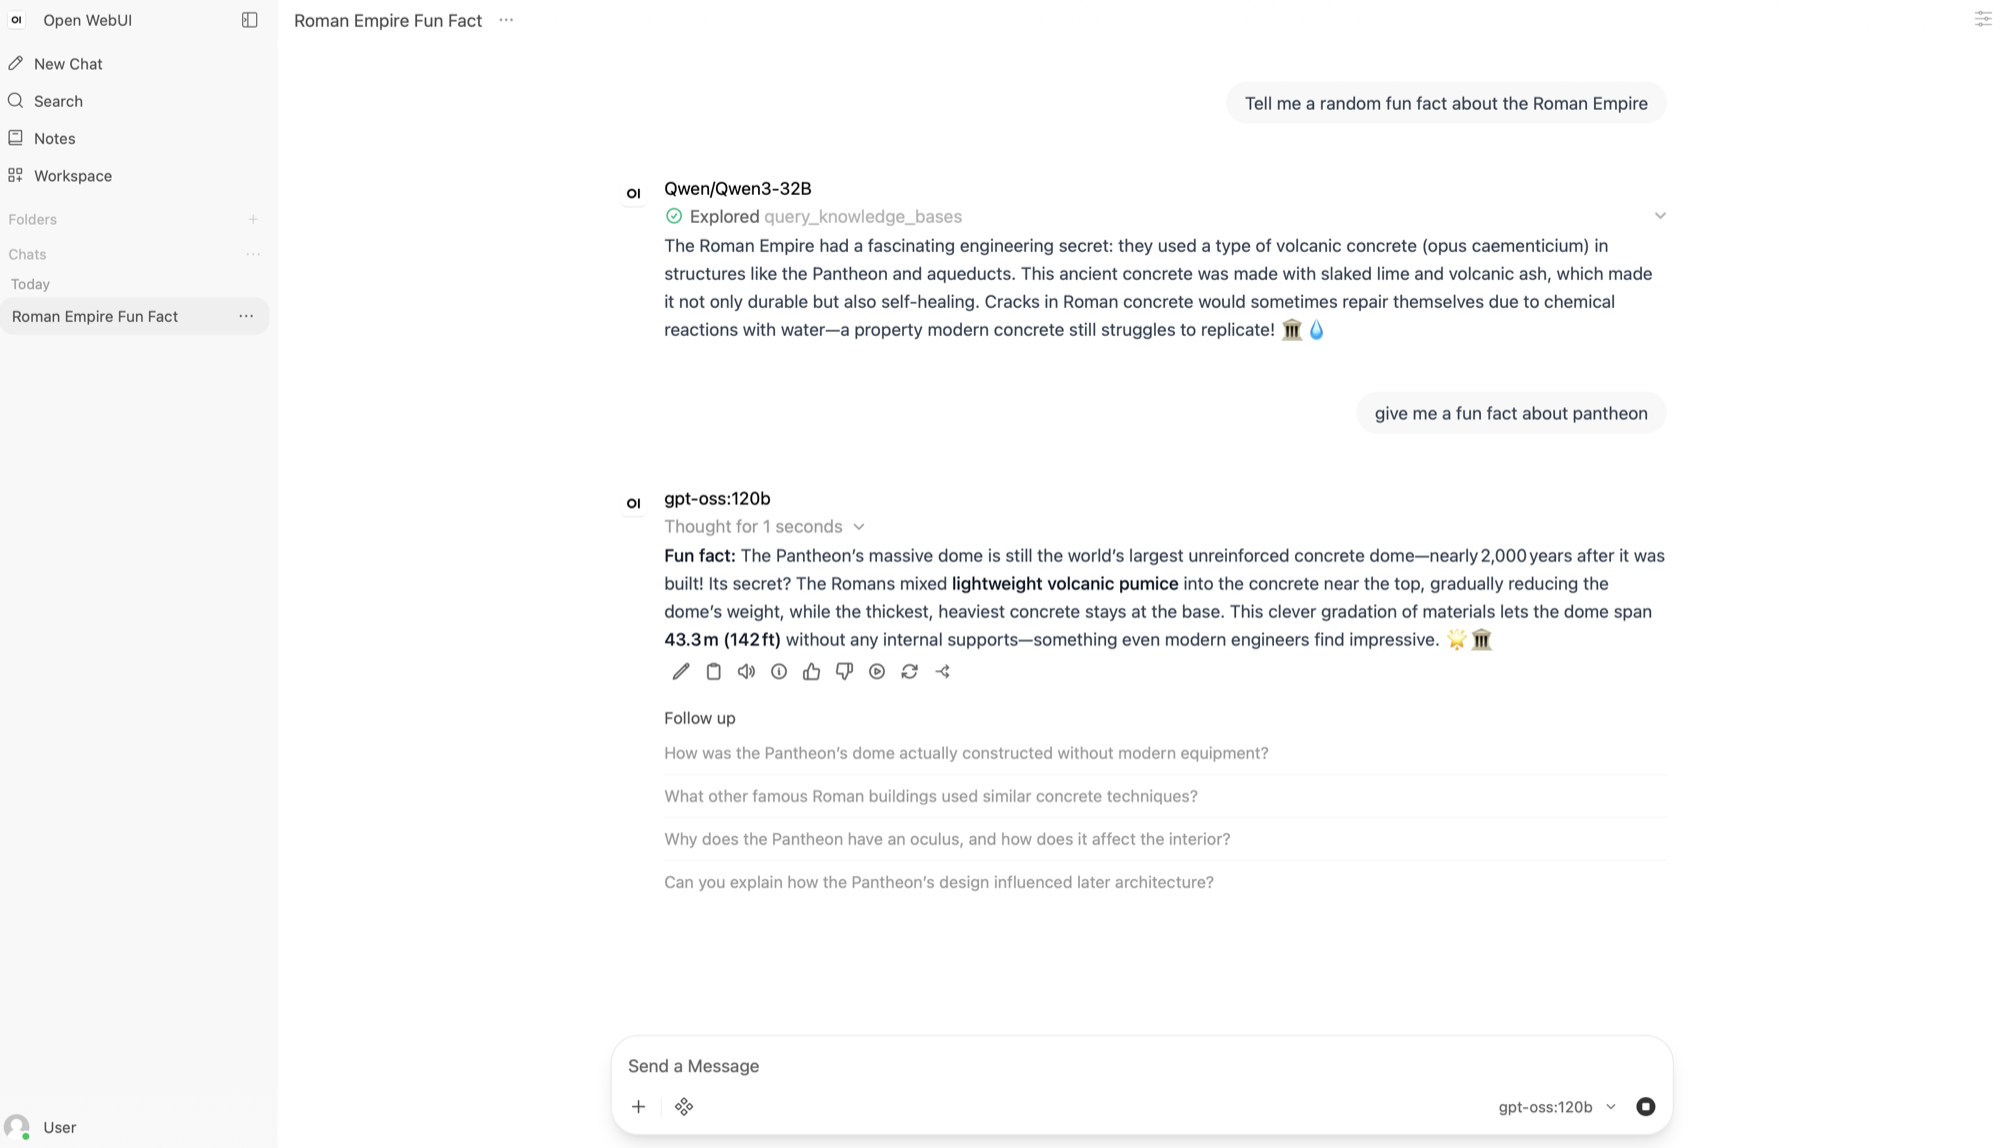
NIM-served Qwen3-32B and Ollama’s gpt-oss:120b sit on a single GB10 together:
| Model | Served by | Notes |
|---|---|---|
gpt-oss:120b | Ollama | 64.5 GB resident |
Qwen/Qwen3-32B | NIM | 9.4 tok/s |
Unified memory helps. It is one 121.6 GB pool, with no VRAM ceiling to divide up. But the reason these two fit together is that they are served by two different runtimes, and that turns out to matter more than the raw capacity.
Here is the part I got wrong the first time, and it is worth spelling out because the obvious explanation is wrong in two ways.
Loading qwen3:8b (11.5 GB) evicted gpt-oss:120b (64.5 GB) completely, even though together they need about 76 GB out of 121.6. My first reading was “Ollama only runs one model at a time”. That is not it either. Three combinations:
| Pair | Combined | Result |
|---|---|---|
qwen3:8b + llama3.2:1b | 17.9 GB | both resident |
gpt-oss:120b + llama3.2:1b | 70.9 GB | both resident |
gpt-oss:120b + qwen3:8b | 76.0 GB | 120B evicted |
So Ollama is perfectly happy with two models. What it will not do is spend more than somewhere between 70.9 and 76 GB on them. That is a budget of its own, well below the memory that is actually free. Add a 1B to a resident 120B and it fits. Add an 8B and something has to go.
That bracket is two measurements, not a number read out of a config, so treat it as approximate. But the shape is clear. Eviction here is a memory-fit decision against Ollama’s own ceiling, not a scheduler refusing you a second model.
That is what makes the NIM pairing interesting, and it is where I had the wrong number the first time. I had sized the NIM side from its weights, 19.3 GB on disk, and that is not what it reserves.
vLLM takes a fraction of the whole pool, set at startup, regardless of how big the model is. You can read it back out of the running server:
| |
0.3 of a 121.6 GB pool is about 36.5 GB reserved for a model whose weights are 19.3 GB. Size the fraction from the weights and you will be wrong by nearly double.
So rather than do the arithmetic, here is the box with both runtimes up:
| Total unified memory | 121.6 GB |
| In use, both serving | 108.4 GB (89.1%) |
| Free | 13.3 GB |
Ollama’s gpt-oss:120b | 64.5 GB resident |
| NIM’s reservation (0.3) | ~36.5 GB |
108.4 GB in use, against an Ollama ceiling of roughly 71 to 76 GB. The pair is using far more of the box than Ollama will ever allocate on its own. That is the point, stated as a measurement rather than a subtraction. The combination exists only because NIM is a separate process with its own reservation, and Ollama’s budget does not apply to it.
So “unified memory explains it” is not wrong so much as aimed at the wrong thing. The 121.6 GB is real, and two runtimes together do use more of it than Ollama ever will alone. It just does not explain Ollama’s behaviour, because Ollama declines to spend it.
Getting the fit wrong costs you a 17.4 second reload of the 120B, and that is a cold number, straight off disk. Trigger an eviction and reload it a minute later and you will measure roughly zero, because the weights are still in page cache. Two very different numbers for the same operation, depending on nothing you can see.
One thing I have not tested is whether keep_alive=-1 makes a model immune to eviction. Every result above is under the current 5m default. Do not assume a pin would have survived it.
That also finishes the pinning story. With KEEP_ALIVE back at 5m nothing on this box is pinned any more, including the 120B. expires_at is a few minutes out and refreshed on every request. The model is resident because it is being used, not because anything is holding it. From outside those look identical, which is the whole point of the section above.
The model picker is also where the MCP work from the previous posts shows up again. Next to the raw models sit the per-system assistants, each scoped to one set of tools:
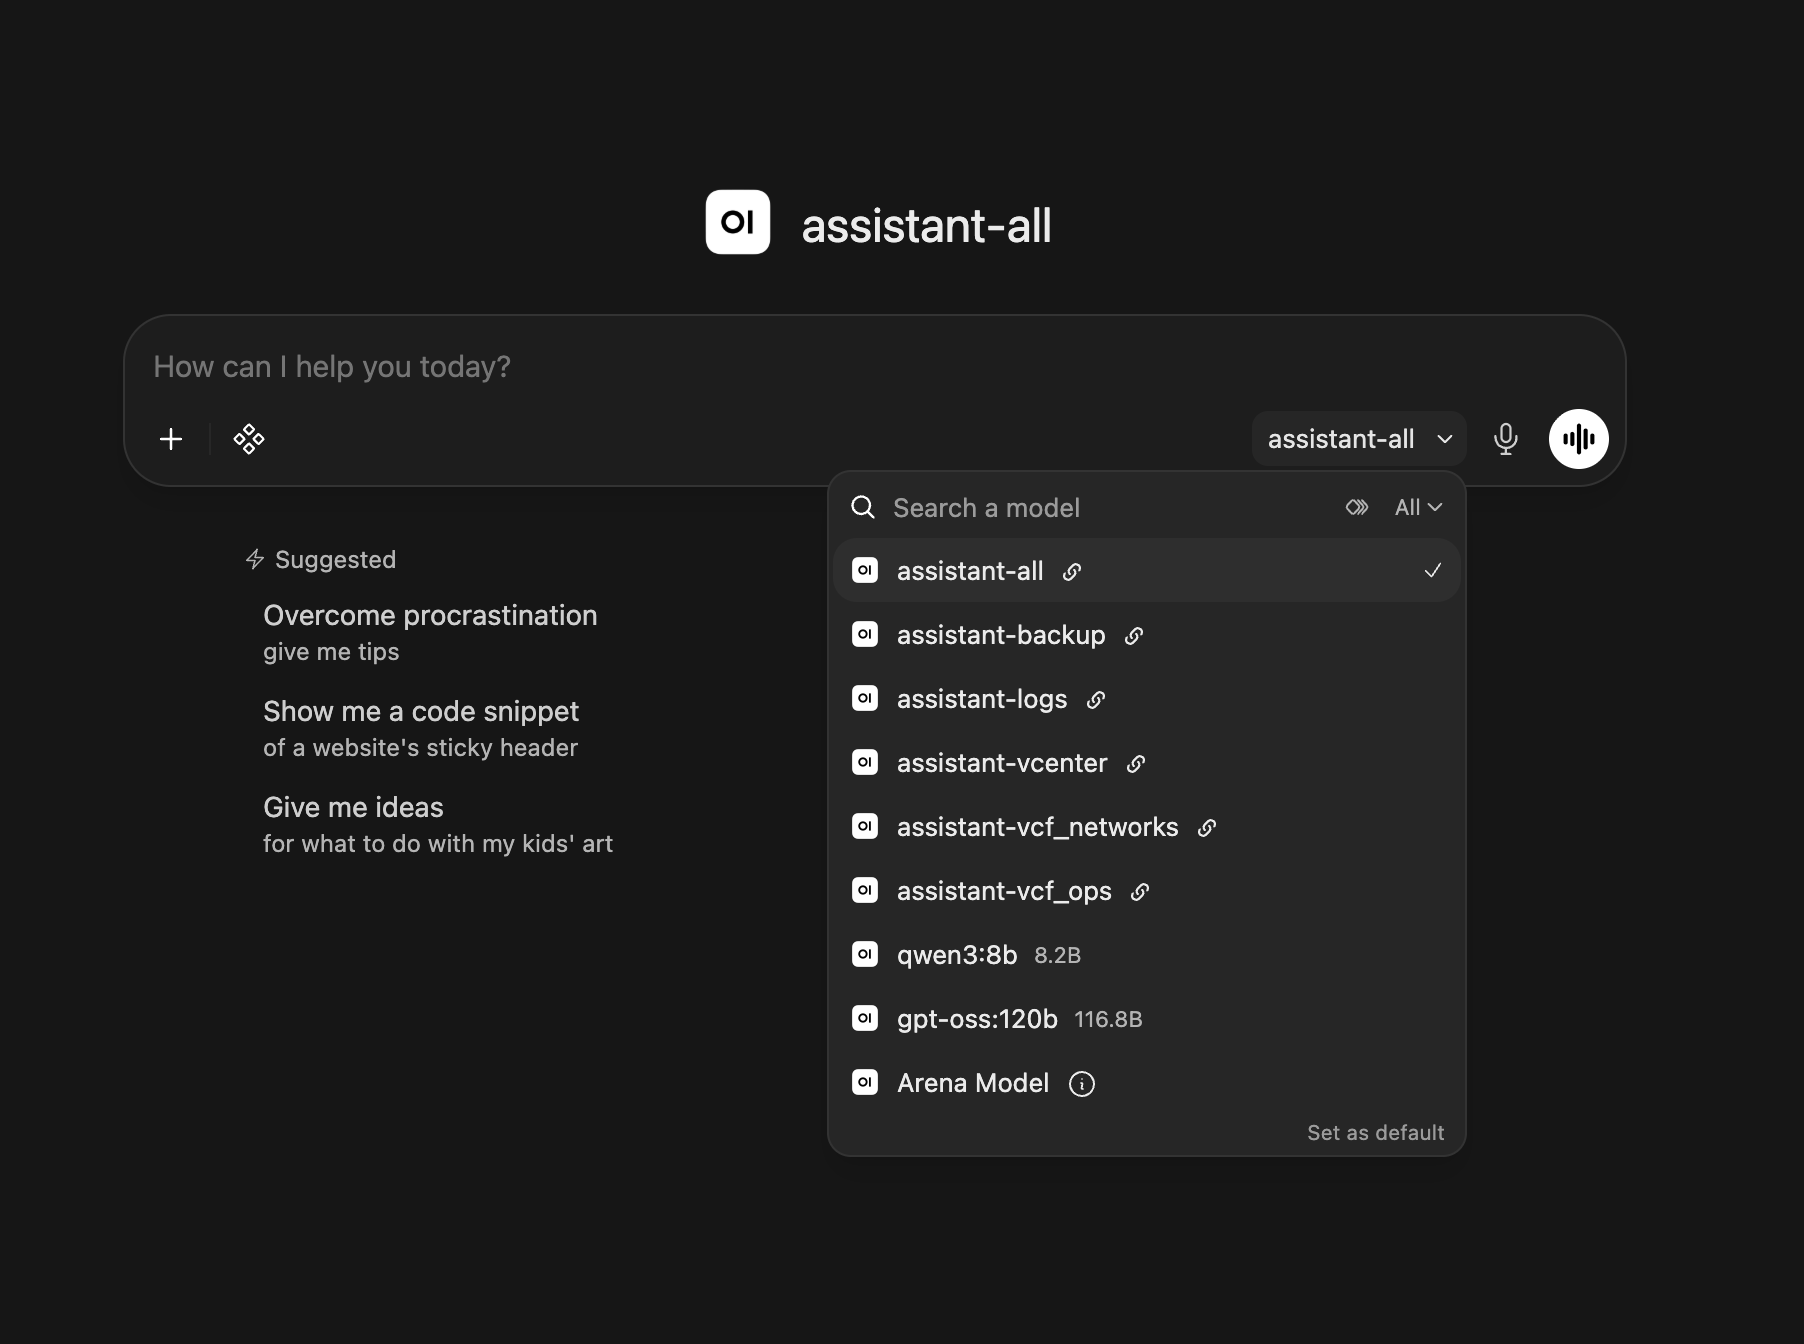
assistant-vcenter, assistant-vcf_networks, assistant-vcf_ops, assistant-logs, assistant-backup, and assistant-all when I want everything. It is the scope selector from the previous post promoted to a first-class model choice. It also trims the schemas sent to the model, instead of making it pick from seventy-two tools to answer a question about backups.
One thing worth being clear about. Choosing a narrower assistant is convenience, not authorisation. I said in that post that everyone who gets in gets the same tools, and that is still true. The dropdown is something the user picks, not something enforced on them. Roles are still the real fix.
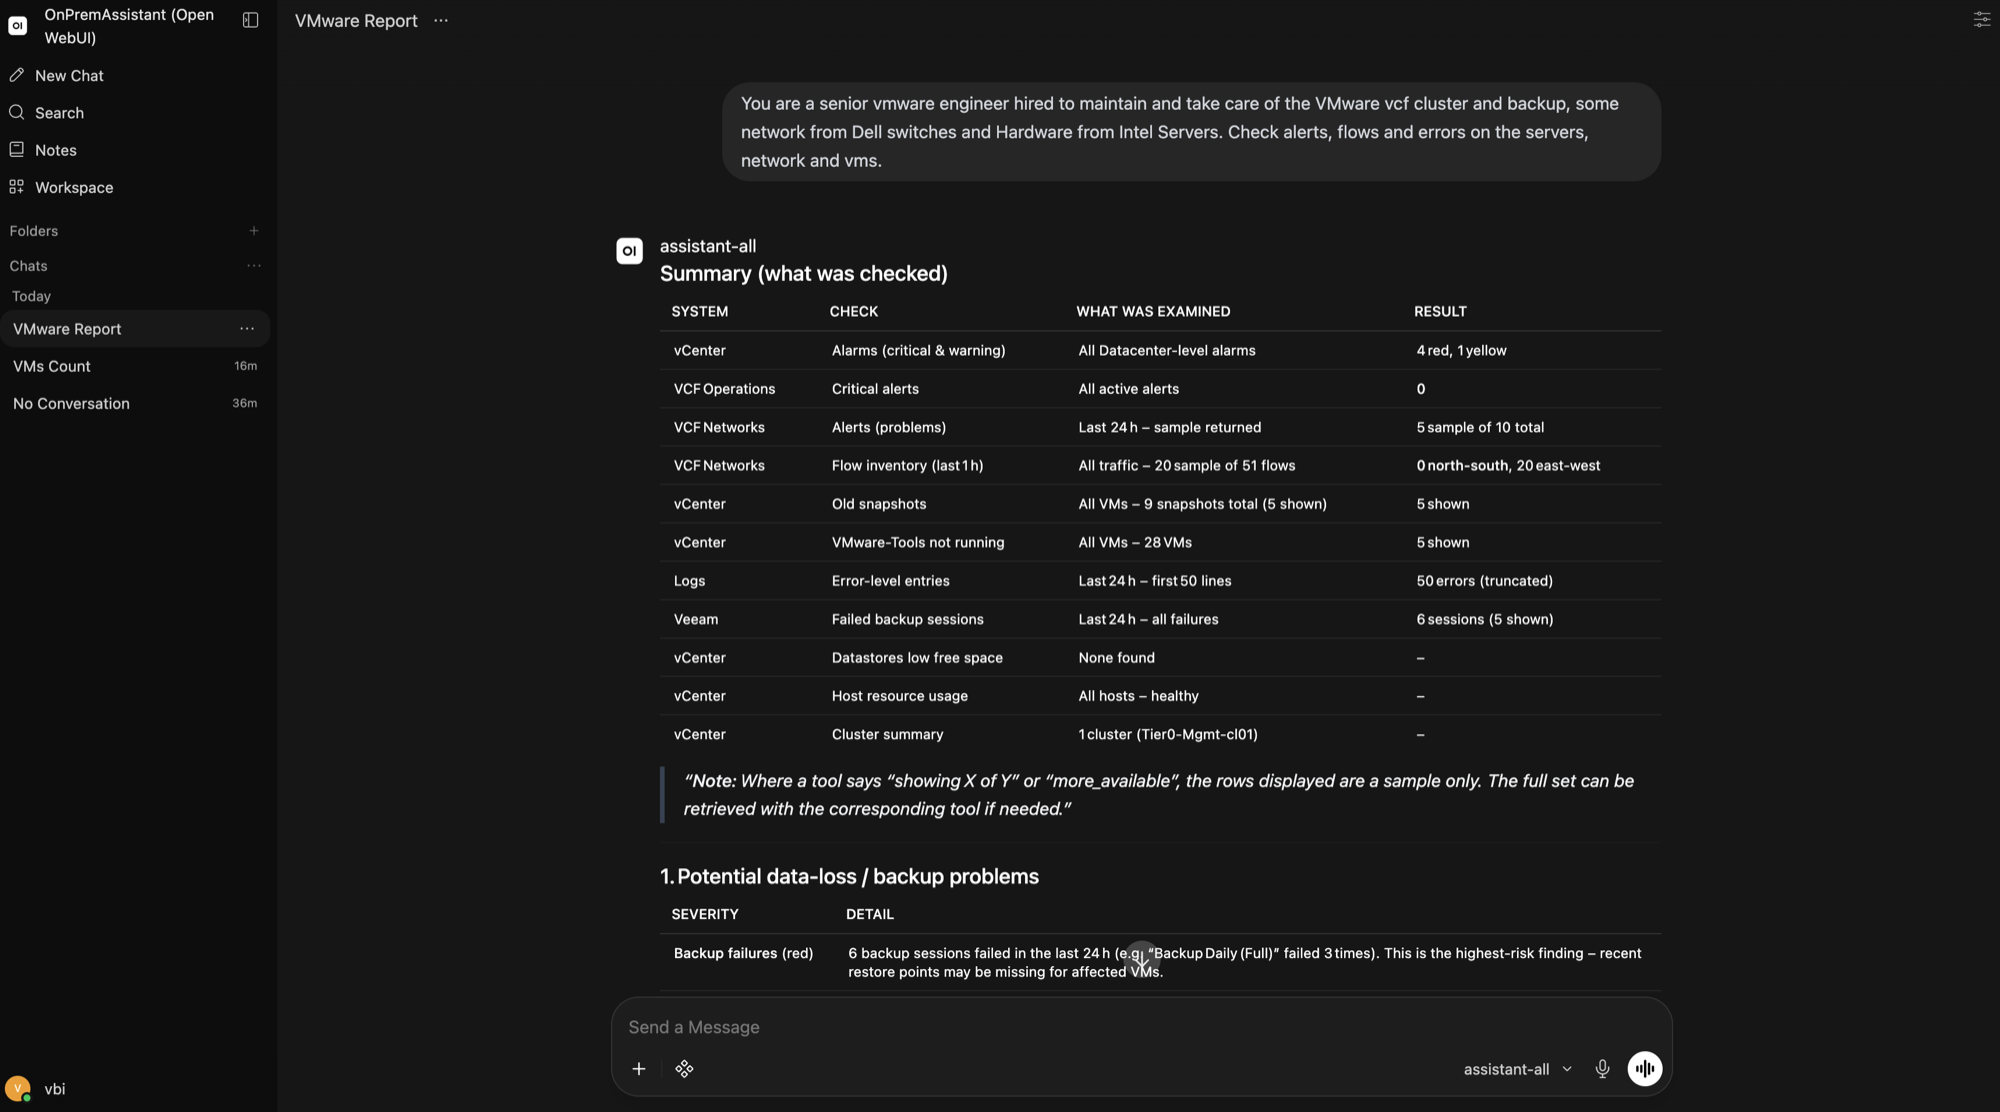
And the same interface talks to the VMware datacenter through that MCP tooling:
Conversations get some organisational furniture too, with search, folders, archive, export and tags:
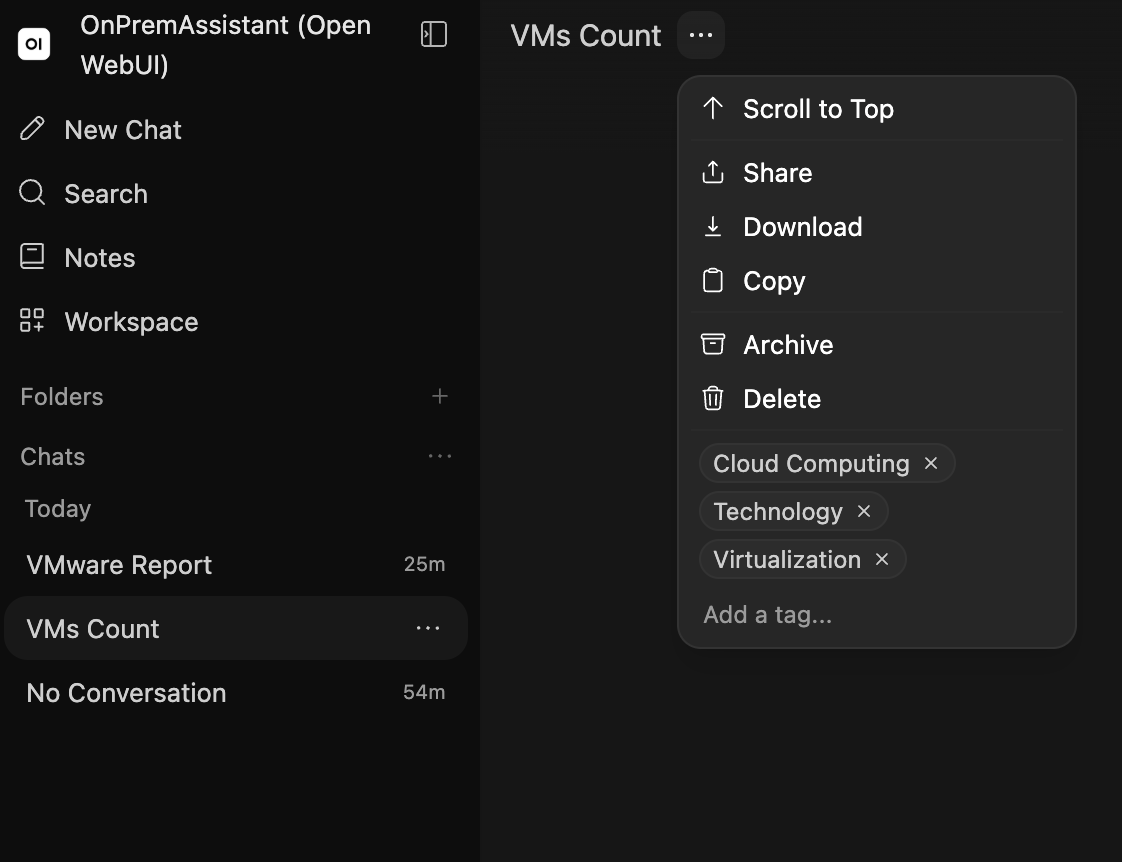
This is small stuff next to the rest, but it is part of the difference between a demo and something you actually keep using. Finding “that report about backup coverage” three weeks later stops being a scrolling contest.
What I learned
The three failures appeared in sequence. Compose had to load before Workbench could resolve the volumes, and the volumes had to resolve before the empty model cache mattered.
My command-line test passed because Docker Compose normalised the project name. It could not reproduce the Workbench failure. I now check that a test can reach the same failure condition before I trust a green result.
I also found that the same status can have different meanings. 0 GPUS REQUESTED first meant that Workbench could not parse the Compose file. After I fixed that, it meant that the badge counted count while my allocation used device_ids. The first state was broken and the second was working.
The blank page and the long model download had the same problem. Neither produced a useful error, so I had to check the asset requests, volume contents and running processes directly.