In the last post I put an NVIDIA GB10 in a cupboard, loaded gpt-oss:120b into its 121 GB of unified memory, and left it there permanently warm. The closing line was that having a model always resident and always reachable changes what is worth automating. Tasks you would never wire up against a metered API become obvious when inference is free, private and already loaded.
I tested that by connecting the model to my VMware datacenter through a read-only API layer. I asked it what was wrong. It found that 52 of 63 virtual machines had no restore point, including two domain controllers and the machine hosting the assistant itself.
The backup tool had reported zero unprotected objects for months. That result was technically correct, but it only counted objects the backup tool already knew about.
This is a lab. It is a full VCF stack with vCenter, NSX, Operations, Log Insight and Veeam, but it does not run production workloads. This made it a safe place to test the integration. The useful finding was not the number itself. It was that the existing checks had looked healthy because they measured the wrong set of VMs.
Where the components run
The laptop is now only a client. I run the model on the GB10 at home and the orchestrator on a VM next to the datacenter APIs:
| |
Inference happens at home, on a shelf. The agent loop and the web UI run in the datacenter, next to the systems they read. My laptop is a browser and nothing else. It holds no model, no credentials and no data.
The API queries stay inside the datacenter because the orchestrator runs next to the systems it reads. Only the prompt and answer travel between the orchestrator and the GB10.
The stack:
| Inference | GB10 · gpt-oss:120b · 61 GB resident · 131 072 ctx |
| Orchestrator | Photon VM · Python · FastAPI · 72 tools across 5 systems |
| Interface | Web UI · threaded history · CSV/PDF export · scheduled reports |
| Datacenter | vCenter 9.0.2 · 5 × ESXi 9.0.1 · 63 VMs |
| Transport | Tailscale, three nodes, tag-scoped |
| Tests | 223, run before every deploy |
Five systems, one question
The last article had the model answering from its own weights. This one has it answering from the datacenter, through five read-only API wrappers running as services on a single Windows box. One per system, each one fronting a product API that speaks a different dialect:
| System | Tools | What it answers |
|---|---|---|
| vCenter | 20 | Inventory, hosts, clusters, datastores, alarms, VM state, hardware versions, Tools |
| Operations for Networks | 19 | VM-to-VM flows, IP and port-group mapping, VLANs, network events |
| VCF Operations | 18 | Capacity, health, efficiency, chargeback, active alerts |
| Veeam | 6 | Jobs, sessions, restore points, repositories, protected objects |
| Operations for Logs | 4 | The actual log entries behind an event, by time window and query |
| Cross-system | 5 | triage_vm, triage_host, triage_estate, backup_coverage, estate_versions |
Seventy-two in total, exposed to the model as functions. Almost all of them read.
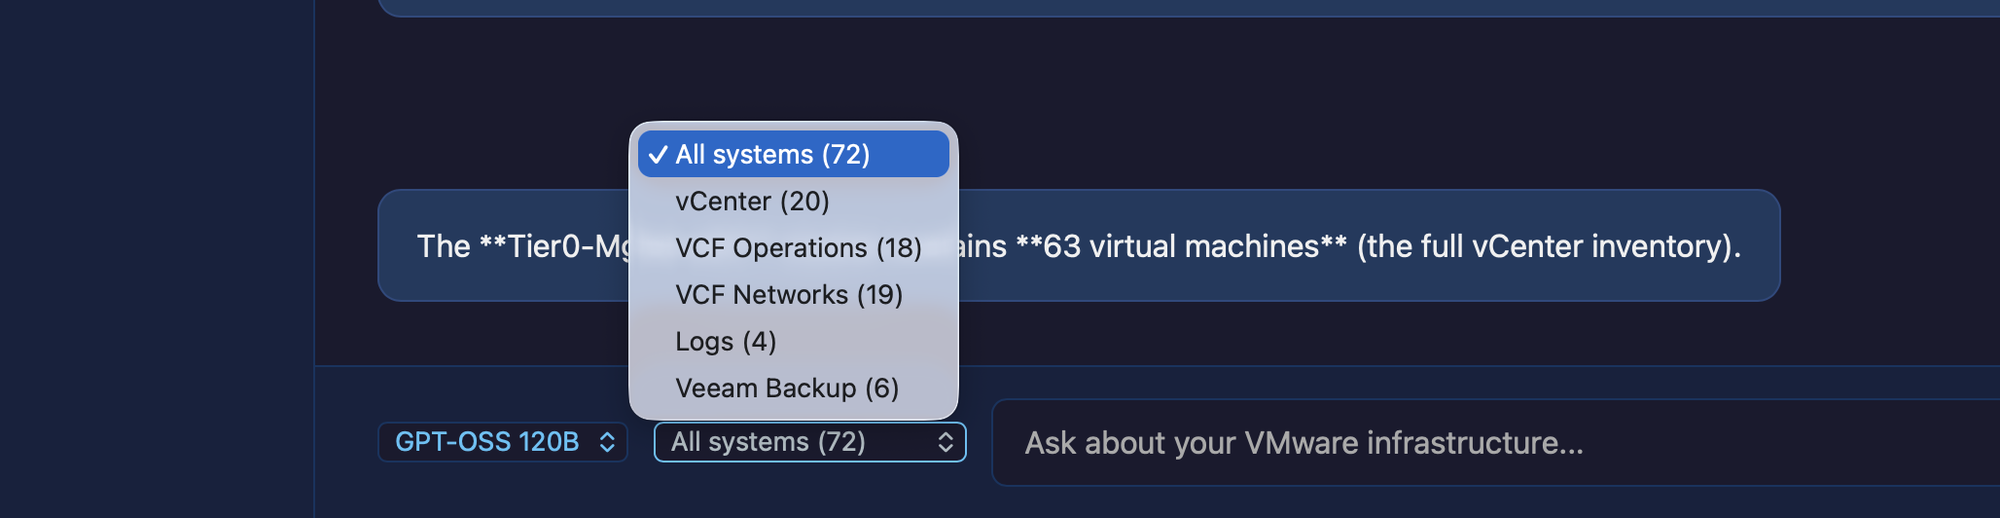
The five cross-system tools combine results from more than one product. They answer practical questions such as whether a VM is healthy, patched and backed up.
Logs and Veeam were the two most recent additions, and they changed the character of the answers. Before them, the assistant could tell you that an alarm existed. Now a single question can cross all three axes: VCF Operations says this host is unhappy, what do the logs say happened at that timestamp, and is anything on it backed up? Any one of those systems has a perfectly good UI of its own. What none of them has is the other four.
This is also where the honesty rules pay off. Five backends means five things that can be down. So a triage reports failures per section instead of stopping, and it says which sections it could not examine. An answer assembled from four of five systems that does not mention the fifth is worse than no answer.
The dropdown above narrows the scope when you already know where you are looking. That also trims the schemas sent to the model, so it is not choosing between seventy-two options to answer a question about backups.
What it’s allowed to do
The previous version of this project claimed “read-only by design” in an article, and I later admitted in passing that I had removed the protection because it was a lab. That is the kind of small dishonesty that is worth not repeating. So this time the constraint is mechanical instead of aspirational:
- Writes are proposals. A state-changing tool returns a description and a token. Nothing happens until a human confirms it.
- Scheduled runs are read-only regardless of configuration. Not “read-only by default”. The write schemas are withheld completely from an unattended run, and an invented write-tool name is refused. Nobody is watching a job that fires at 07:00.
- There’s a test that fails if the registry ever contains no write tools, so the previous guarantee cannot pass by accident on an empty set.
That last one is a good habit in general. A test asserting “unattended runs cannot write” passes beautifully in a system that cannot write at all. Pin the premise too.
Sharing one GPU with itself
Here is a constraint the first article never hit, because it only ever ran one thing.
The GB10 has a single pool of unified memory and no MIG partitioning. A 61 GB model pinned resident is 61 GB that nothing else can have. The moment I wanted to run an NVIDIA NIM container under AI Workbench on the same box, the always-warm assistant became the problem. The feature and the obstacle were the same feature.
The obvious fix is to stop pinning the model. But then the assistant pays a cold start of tens of seconds on every first question, and that is exactly what made scheduled autonomy work in the first place.
The actual fix is that residency should be a control, not a setting. Ollama accepts a per-request keep_alive that overrides its service default, and a request with no prompt loads or evicts the model without generating anything. So:
| |
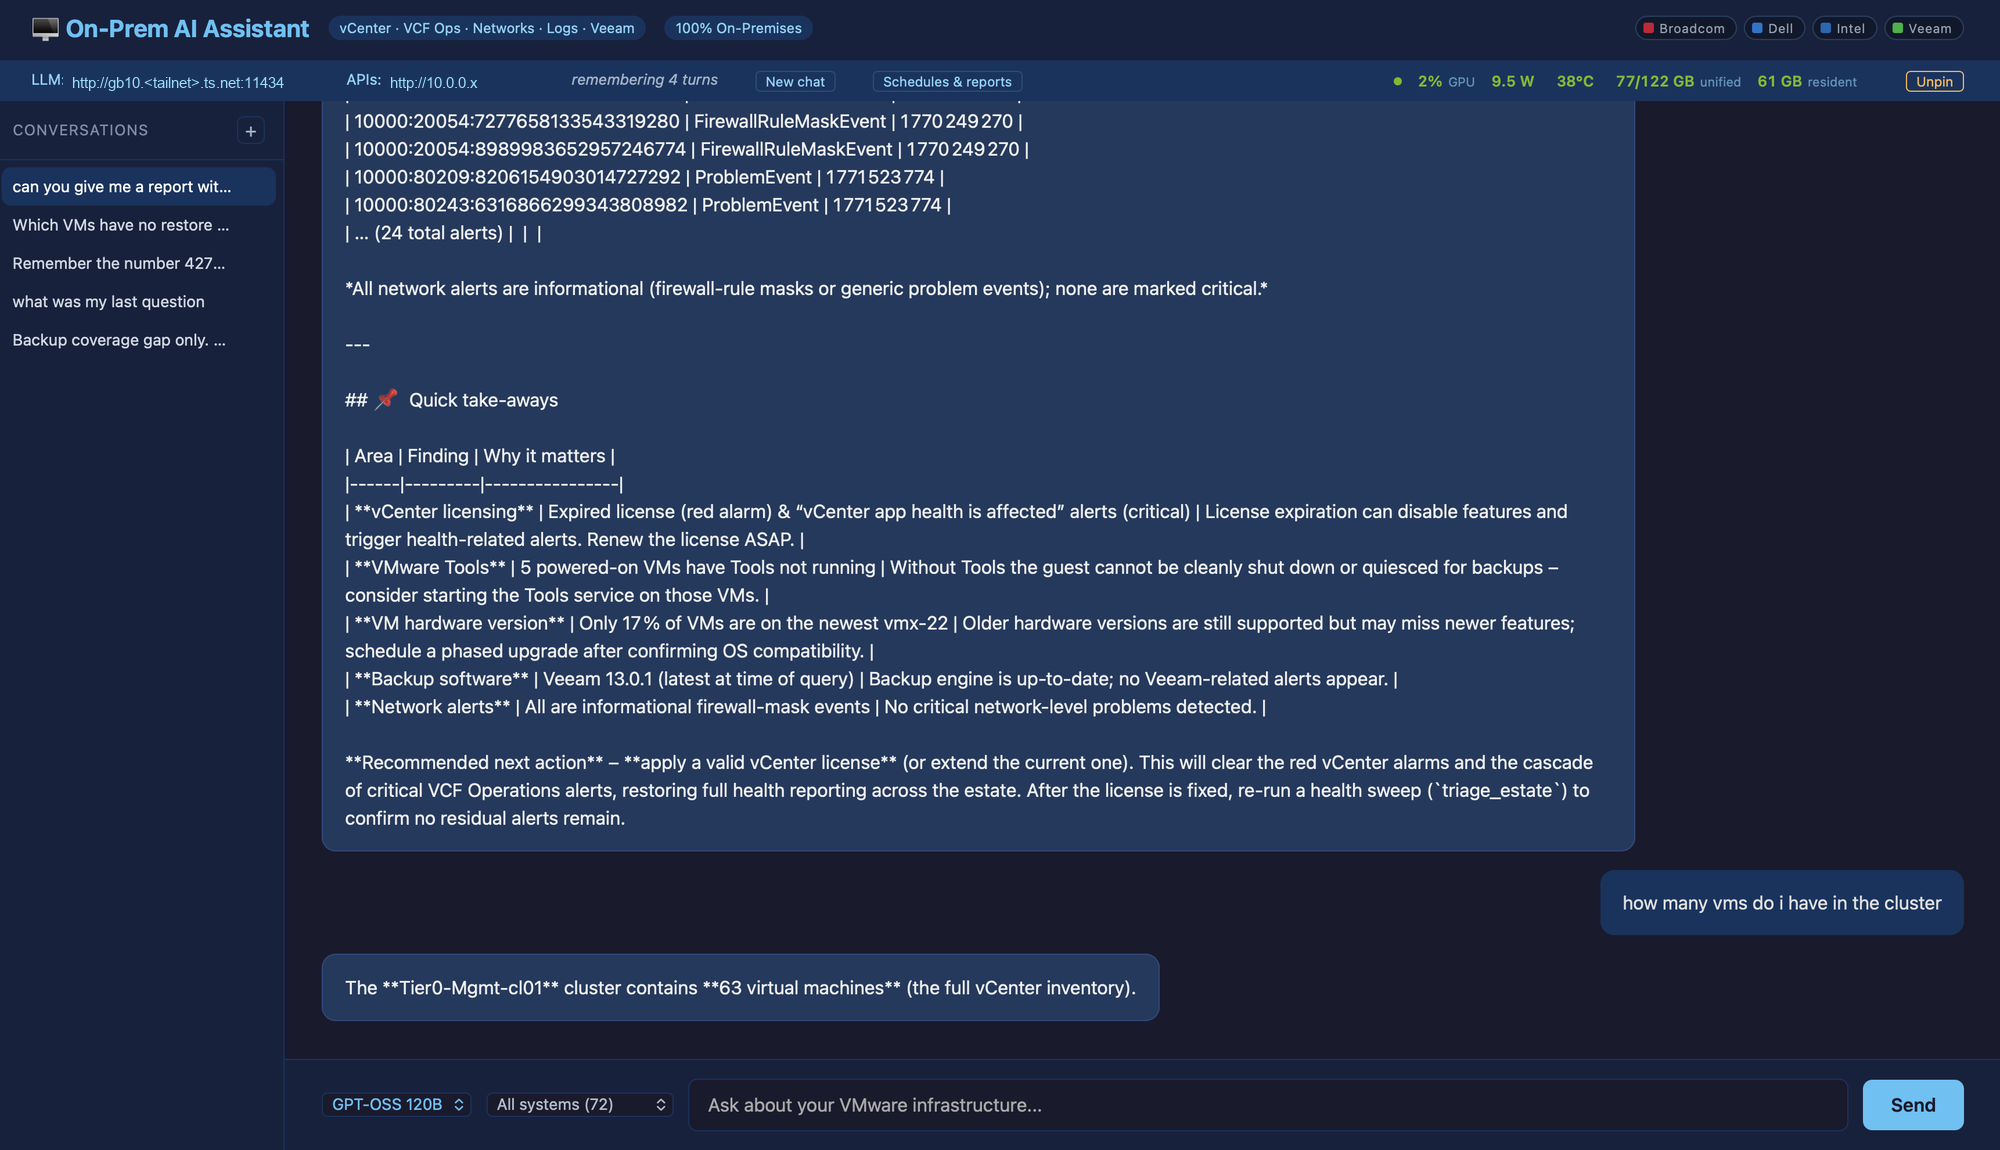
Two endpoints on the orchestrator, and a button in the web UI that shows what is resident and how many gigabytes it is holding. Pinning a 120B reloads it from disk, so the button says Loading… and reports how long it took. That is usually tens of seconds, and it is worth showing rather than hiding behind a spinner.

61 GB of the 122 GB unified pool held by the model, 77 GB in use overall, drawing 9.4 W at idle. That is a 120-billion-parameter model sitting warm and costing almost nothing to keep there. Press Unpin and that 61 GB comes back.
The point is what it does to the workflow. A shell script wraps the same endpoints:
| |
up notices there is not enough free memory, works out that the assistant is almost certainly why, and releases it. down puts it back. The two workloads now take turns on one GPU without touching systemd on the inference host, and without SSHing anywhere.
They do not run in parallel. 121 GB is not enough for that, and pretending otherwise would just give me two things that swap constantly. But they run serially, on demand, from a browser. That is the difference between “I have a dev box” and “I have a dev box I actually use”.
One bug is worth recording, because it is a good example of a whole class. The compose file writes ASSISTANT_MODEL= when the variable is unset. os.getenv("ASSISTANT_MODEL", DEFAULT_MODEL) handles absent. It does not handle present and empty. The model name became the empty string, and pinning silently pinned nothing.
From a chat box to something you’d actually use
The first article ended by promising more scheduled jobs. This is that, plus the boring things that turned out to matter more than any of the model work.
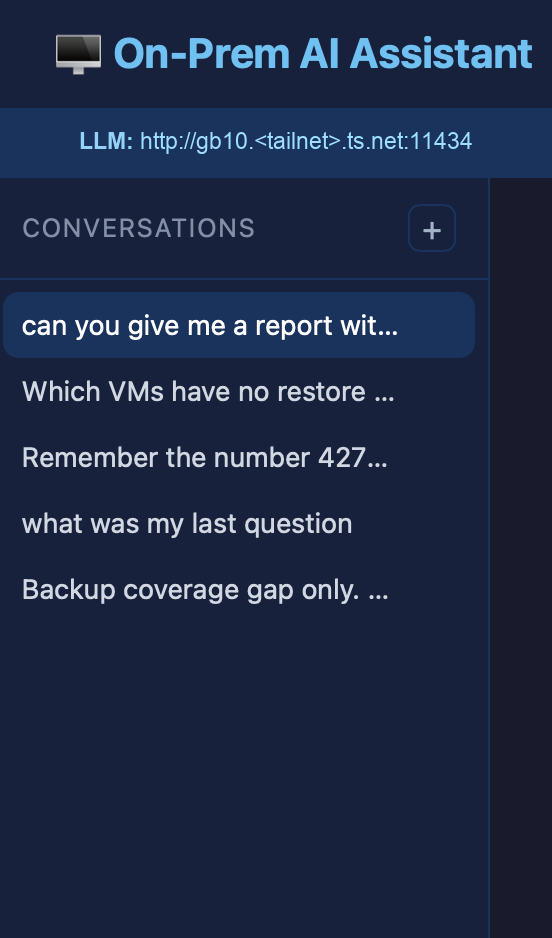
It remembers. Every turn is stored server-side against a conversation id, and the last several turns are replayed on each request. So “and which of those are powered on?” resolves against what “those” meant, instead of starting from nothing. The id is persisted in the browser too, so closing the laptop lid and coming back does not quietly start a new thread.
There’s a sidebar. Past conversations are listed down the left with their first question as the title and a relative timestamp. Click to reopen, and delete the ones that were experiments. It was trivial to build, and it changed how I use the thing completely. Questions stopped being disposable. The morning check is now a thread I return to, not something I retype.
Answers leave the browser. Nobody’s decision-maker is going to read a chat transcript.
- Every table the model produces gets a Download CSV button. It is UTF-8 with a BOM so Excel does not mangle it, and markdown emphasis is stripped so a cell reads
Low (degradation)rather than**Low** (degradation). - Export PDF opens a clean print view and calls the browser’s own PDF writer. There is no PDF library, and that is deliberate. A box that talks to five live systems should not be pulling a vendored megabyte off a CDN to print a report. The print stylesheet hides the UI chrome, repeats table headers across pages, avoids splitting rows, and stamps the output with the question asked, the model, the timestamp, and source: live datacenter APIs, read-only. A table in a PDF with no provenance is just a claim.
And it runs without me. Schedules are hourly, daily or weekly, all in UTC. A report that shifts by an hour twice a year is a bug nobody notices until the reports have been wrong for months. Runs are stored with their answer, the tools called and the token usage. Due jobs fire strictly one at a time, because three tool-calling runs hitting five APIs at once is a self-inflicted load test.
Four decisions in there are worth more than the feature itself:
- A scheduled run gets no write tools at all, and the schedule form has no way to opt out of that.
- The schedule is advanced before the run starts. A run that crashes the process must not leave the job permanently due and re-firing on every restart.
- A recurring job is told what it said last time, so the 07:00 report leads with what changed. It is explicitly instructed to say when nothing has, rather than padding.
- A failed run is recorded, not swallowed. The failure mode worth designing against is not a job that errors. It is a job that quietly stopped producing reports while the service stayed green.
The due-time arithmetic lives in its own module as pure functions over an explicit “now”. That makes the awkward cases unit-testable without waiting on a clock: a daily job created after today’s slot has passed, a weekly job created on its own weekday, a service restarted after a day of downtime. And a schedule that could never fire is rejected at creation rather than stored. hour=25 looks perfectly fine in a list and simply never runs.
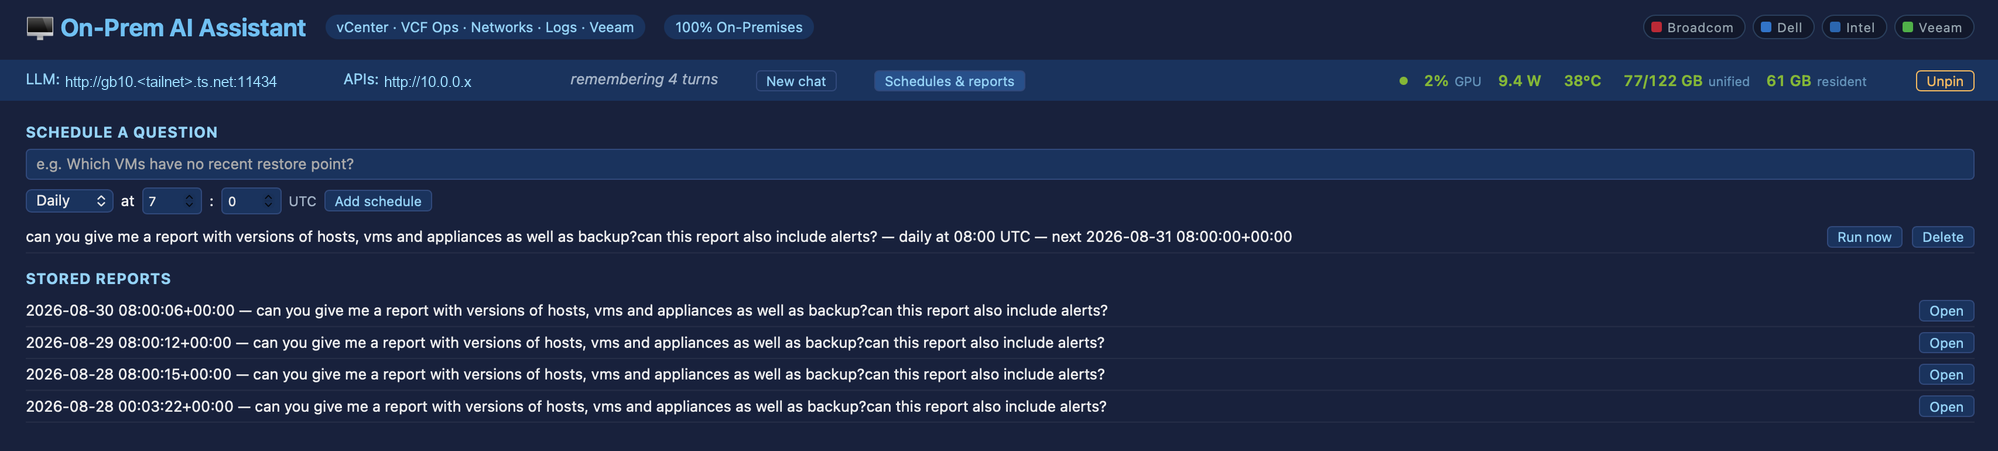
That screenshot is the part I find most satisfying, and it is the least impressive-looking thing in this post. Four stored reports, three of them from consecutive mornings at 08:00 UTC, produced by a box in a cupboard while I was asleep. Each one is a full datacenter sweep across five systems, and each one is still openable months later.
The question that mattered
With the plumbing done, the real test was whether a local model reading live infrastructure produces anything you could not get from a dashboard.
I asked it what was wrong with the datacenter. It came back with vCenter alarms, expired licences, VMs on old hardware versions and VMware Tools out of date. The usual hygiene, correctly ranked, with tables I could export to CSV or PDF.
Then I asked about backups, and it said something more interesting than an answer:
Veeam reports 0 objects without restore points. However, this only covers objects Veeam already knows about. I have no tool that can enumerate every protected object, so I cannot tell you which vCenter VMs are absent from backup entirely.
It returned an empty table rather than inventing one. That refusal was the most valuable output the system produced, because it identified a gap in itself.
And it was right. The unprotected endpoint fetched Veeam’s backup objects and then filtered out everything that had a restore point. That discards exactly the data needed to answer the question. It could only ever describe objects already in a job. A VM that nobody had added to a job simply did not exist as far as that query was concerned.
So the headline number was true and useless:
0 objects without restore points — measured over 11 objects, in a datacenter of 63 VMs.
The reassuring answer and the dangerous answer looked identical.
Doing the join properly
The fix was not a cleverer prompt. Asking a model to match 63 names against 11 by hand is asking it to make something up. This one declined rather than guessing, which is the better failure, but it is still not an answer.
Two changes:
- A new endpoint returning Veeam’s full roster, including objects with zero restore points, paged properly, and reporting whether the fetch was complete against the server’s own total. A half-fetched roster would invent unprotected VMs, so a partial result has to be able to say so.
- The join done in code, not in the model. Fetch the entire vCenter inventory, fetch the entire Veeam roster, normalise names for case and DNS suffix, diff them, and return the gap.
It also separates two failure modes that look the same in a summary and mean completely different things:
- absent from Veeam entirely — never protected, nobody ever added it
- present with no restore point — a job exists and is failing
And if either system is unreachable, it reports coverage as unknown rather than falling through to a count that reads like a pass. An unavailable check is not a passed check.
The result, live:
| VMs in vCenter | 63 |
| Objects known to Veeam | 11 (roster complete) |
| VMs with a restore point | 11 |
| VMs with no restore point | 52 |
Of those 52, roughly nine are templates and nine are nested ESXi VMs, which are arguably excluded on purpose. That still leaves around 26 powered-on, real workloads with no backup whatsoever, including two domain controllers, all three NSX managers, the log appliance, and the two machines hosting this assistant’s own API layer.
The demo was not backing itself up.
Who is actually asking?
Everything above runs behind a tailnet, and for a while I treated that as the security story. It is not. A tailnet answers which machines can connect. It says nothing about who is at the keyboard, and those are different questions the moment a device is shared, borrowed or left unlocked.
What was actually sitting there was a chat box wired to five infrastructure systems, answering anyone who could open a socket to it. Next to it, on another port, was an API that would run all 72 tools without asking for a name.
The fix turns out to be almost free, because tailscale serve already knows who you are. It terminates TLS and adds the caller’s identity to every request it forwards:
| |
The obvious worry is that a header is the easiest thing in the world to fake. So I tested it instead of trusting it, and the result is the part worth remembering:
| Path | Forged Tailscale-User-Login |
|---|---|
Through tailscale serve | Overwritten with your real identity |
| Straight to the app’s port | Passes through untouched |
The header is not trustworthy. The header on the proxied path is trustworthy. That distinction is the whole design, because it means the header is worthless on its own. You also need certainty about which path the request took.
That certainty is a network property, not an application one. Bind the service to 127.0.0.1, and the only thing that can connect is the proxy on the same machine. So the two checks answer two different questions, and neither one is enough alone.
| Layer | Answers | Guaranteed by |
|---|---|---|
| Loopback bind | Did this come via the proxy? | The kernel — you can see it in ss -lntp |
| Identity header | Who sent it? | Tailscale — only meaningful given the row above |
This is why the service now refuses to start if you ask for identity checking while bound to 0.0.0.0. That combination is not half-secure. It is decoration, because anyone who can reach the port supplies their own name. A configuration that looks protected is worse than one that obviously is not.
You can watch both halves work from opposite directions. Through the tailnet URL, /api/whoami returns my login. From a root shell on the box itself, the same request is refused, because a local shell cannot produce an identity. It cannot forge one either, since the only path that sets that header overwrites whatever you send.
The bit that nearly locked me out
I wrote thirteen tests. All thirteen passed. The implementation would have locked me out of my own datacenter completely.
Uvicorn, by default, honours X-Forwarded-For from a local proxy and rewrites the recorded peer address to the original caller. That is sensible on its own, and it is how you get real client IPs in your logs. But it means that behind tailscale serve, the peer my code inspected was not 127.0.0.1. It was the tailnet address of whoever was asking. My loopback check would have rejected every legitimate request, including mine, on a service that is only reachable remotely.
The tests did not catch it because the test client does not run that middleware. They were exercising a stack that does not exist in the deployed service, and reporting green on it.
I only found it by running the real thing behind a real proxy before shipping. The bind now disables that rewrite deliberately, and a request whose peer address has been rewritten returns a 403 that names the cause. The next person to hit this deserves better than a blank refusal.
The pattern underneath all of it
Every serious problem in this project has been the same problem in a new place: something reported success for a thing it never checked.
systemctl is-activesaid the agent was running. It was running. Its Telegram loop had stalled hours earlier.- Veeam said zero unprotected. It was counting only what it already knew about.
- The chat pane said memory was working. The server’s memory was working perfectly. The browser was starting a new conversation on every reload, because the id lived in a JavaScript variable that a refresh threw away. The comment above that variable claimed a reload picked the thread back up. It never had.
- My own web UI returned a blank
500. The orchestrator had sent a precise explanation, andraise_for_status()in the proxy threw it away and substituted nothing. The one fact needed to diagnose the fault was being destroyed at the last hop. - Tailscale showed my laptop online, healthy, key valid, zero warnings, and zero peers, because I had tagged the machine. Tagging transfers ownership from the user to the tag, so every policy rule keyed to “me” stopped matching. A node in perfect health that could see nothing.
- And then my own test suite did it to me. Thirteen tests, all green, on authentication that would have refused every real request. They were testing a stack that does not exist outside the test suite.
None of these were hard to see once found. All of them presented as a green light.
The habit that catches them is not cleverness. It is refusing to accept a status as evidence of the thing it stands for. Health-check end to end. Ask what population a clean result was computed over. And when a test passes, break the code deliberately and confirm that the test fails. A test that passes against the bug is worth less than no test, because it actively reassures you.
Gotchas worth knowing
Pydantic will accept an omitted field and reject an explicit null. conversation_id: str = None type-checks fine, works in every unit test that builds the model in Python, and rejects every request a browser actually sends, because the browser sends null rather than omitting the key. Defaults are not validated. Supplied values are. Use Optional[str].
with sqlite3.connect(...) commits but does not close. One leaked file descriptor per request. Invisible in a sub-second test run, and fatal over weeks of uptime.
A Tailscale policy file uses either acls or grants, never both. Advice written for one syntax is rejected outright in the other. Check which one your file uses before pasting anything, including anything an AI hands you.
You can’t untag a machine from the admin console. Removing all tags requires reauthenticating the device, and whoever reauthenticates becomes its owner. Also, tailscale up replaces your whole preference set, so it refuses to run unless you restate every non-default flag. That is a guardrail that looks like an error.
A “next run” time must be strictly after now, not at-or-after. Get that comparison operator wrong, and a job that has just finished is immediately due again, and loops as fast as the scheduler ticks. Due-time arithmetic is where scheduling bugs live. Keep it in pure functions you can hand an arbitrary “now”.
Tagged nodes have key expiry disabled. That is the right property for an unattended server and the wrong one for a laptop. Tag the boxes in the cupboard, not the thing in your bag.
Your web framework may rewrite the client’s IP address behind your back. Uvicorn trusts X-Forwarded-For from a local proxy by default and rewrites the peer address to match. If any security decision you make depends on the connection coming from localhost, that default silently inverts it. And your tests will not tell you, because test clients skip the middleware that does it.
What’s still unresolved
Being honest about the rough edges, since the interesting part of a homelab writeup is usually the part that is not finished:
- 26 real workloads still have no backup. These are lab workloads, so nothing is at stake here. But the fix is as boring as the finding was easy, and it still is not done.
- The datacenter’s own alerting is louder than its worst problem. VCF Operations is carrying 99 active alerts. A red “Backup job status” alarm has been showing since April. When everything is red, nothing is.
- No authorisation, only authentication. The UI now knows who you are and can be restricted to named accounts, but everyone who gets in gets the same 72 tools. That is fine for a proof of concept in a lab. It is not fine anywhere real, where a read-only viewer has no business triggering a scheduled report against live infrastructure. Roles are the obvious next step, and the tools are already grouped by scope, so the structure is already there.
- The Veeam service account is an administrator. It should be a read-only account. Everything it does being read-only by convention is not the same as read-only by permission.
- The access path needs sign-off. A personal tailnet terminating on a work VM that reaches five infrastructure systems is a conversation to have with your employer before you build it, not after. I am having it.
Was it worth it?
The 120B model runs well on the GB10, returns its first token in about a second and supports a 131k context without an API charge. Those measurements are useful, but the API integration produced the more important result.
The assistant found a backup coverage gap because it compared the full vCenter inventory with the Veeam roster. It also refused to give an answer before the required endpoint existed. That is the behaviour I wanted from a local assistant connected to live infrastructure.
The GB10 stays available, the data remains on my network and scheduled checks can run before I start work. The next step is to fix the missing backups and add roles so users do not all receive the same tools.
Dell Pro Max GB10 · DGX OS 7 / Ubuntu 24.04.4 · gpt-oss:120b via Ollama · orchestrator on Photon OS · VMware Cloud Foundation 9. Identifiers changed. All datacenter figures are real.