I spent an evening testing three different AI tools on the GB10. Each tool produced a believable result, but I had used it for the wrong job.
This article shows what failed, what I measured and which tool I used instead.
1. A diffusion model cannot draw your datacenter
I asked the assistant to draw my datacenter. It used an image model, which sounds reasonable. What came back was confident, it looked good, and it was wrong in every detail that matters.
So I ran the same prompt through FLUX on the GB10 myself. 1024×1024, and the same settings that had produced a very good product photo an hour earlier.
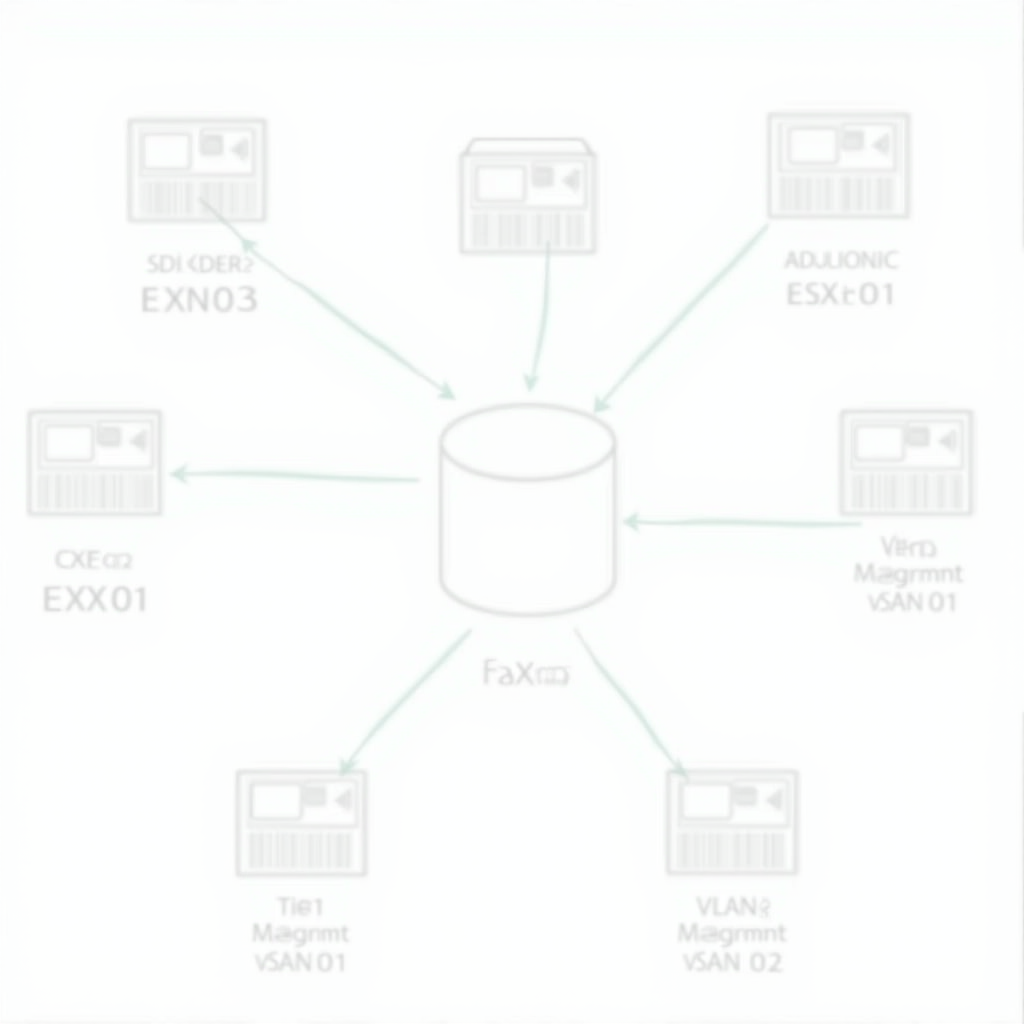
54 seconds on the GPU. That number needs one comment. I checked afterwards how the container was actually started, and found --lowvram on the command line. So this is 54 s for FLUX with --lowvram, while NIM was holding 37 GiB. It is not 54 s for FLUX in general.
Here are the labels from the image:
| |
None of those are hostnames. They only look like hostnames. There are seven server boxes, and I have five hosts. There are no VLAN switches, which was most of the point. The arrows do not connect anything useful, and there is no legend.
Here is the same model, on the same box, with the same settings, doing the job it is built for:
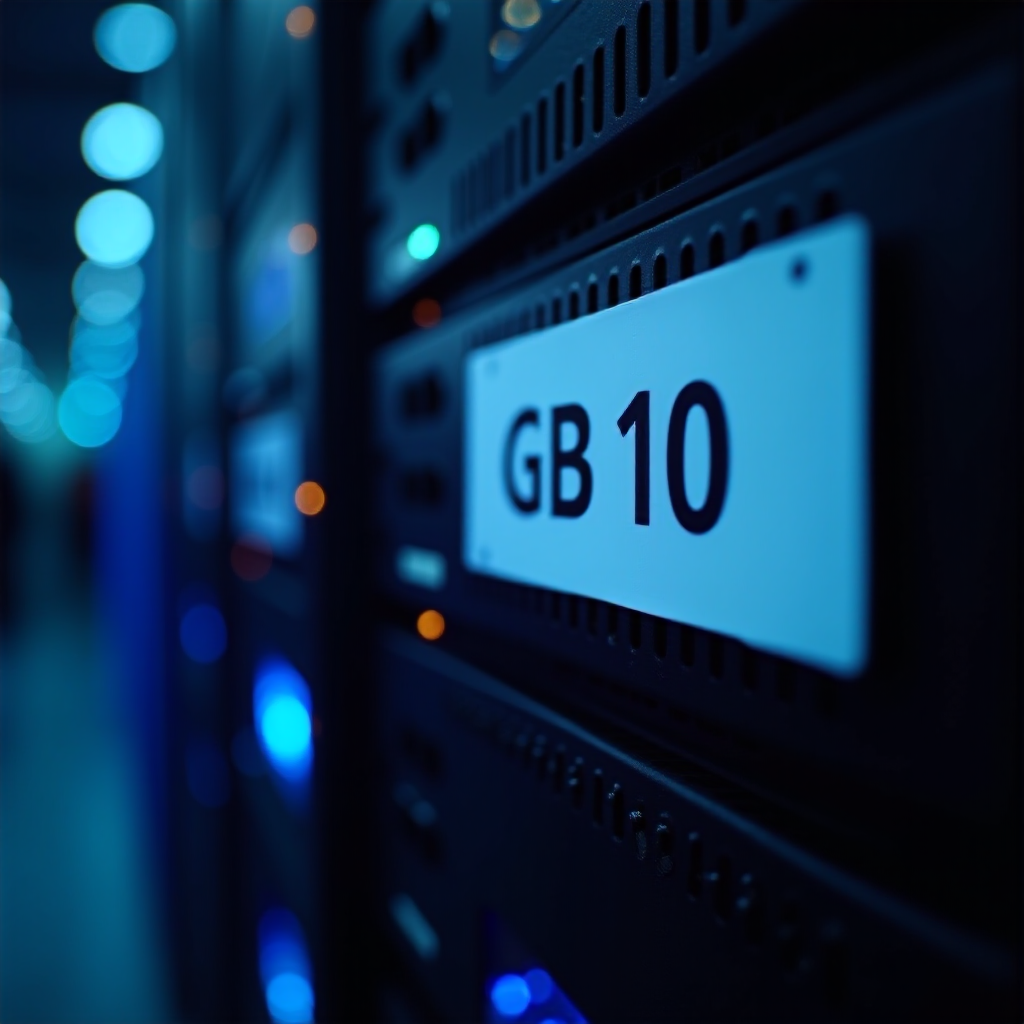
That one is very good. And it shows the problem better than the failure does. Look at the text on the front. Four characters, and it still puts in a space. It says GB 10.
A diffusion model is optimised for images that look right. A technical diagram must contain the correct names and connections. The model struggled with four characters in GB10, so I would not trust it with a diagram containing hundreds of hostname characters.
What you want here is a renderer, not a model. The same content through mermaid-cli, on the CPU, took 1.9 seconds — about 28 times faster than the GPU — and every character was correct. A renderer does not guess what a letter looks like. It draws the one you gave it.
| |
The datastore number in that box came from vCenter at the moment the diagram was rendered. A diagram built from real data can be wrong, and that also means it can be right. A picture of a diagram can be neither.
So the fix was to stop generating diagrams and start rendering them. Every mermaid block in an answer is now rendered to PNG on the server, with the source kept below it. Tested through the live API: 30.8 seconds, HTTP 200, image/png, correct through both proxies.
One more thing about that. The renderer runs with --network none. There are good hosted mermaid renderers, like mermaid.ink and kroki.io, and they would do this job perfectly. But then I would be sending them a map of my datacenter with all the names on it. I do not want that as the default, and it is very easy to end up there by accident, because the hosted option is one line shorter.
2. The vision model is a transcriber, not a source
Next problem. I pasted a screenshot into the chat and got this back:
I’m not able to view the attached PNG directly.
That sounds honest. It is the kind of answer you accept and move on from. It was a guess.
The bug had nothing to do with vision support. The code that handles images only ran when the message text was empty. If you wrote a caption, which is what people normally do when they paste a screenshot, the image was dropped without any error. The model then received only the text, understood from it that there had probably been a PNG, and wrote a clear and reasonable explanation of why it could not see it. The explanation was invented.
A silent failure that explains itself in a believable way is worse than a crash. A crash gets fixed the same day. This one survived for weeks, because the answer looked honest.
After the fix, qwen2.5vl:7b actually received the images. I ran OCR against known values at temperature 0, twice, with the same result both times. The structure was correct, the hostnames were correct, and three of eight VMkernel addresses were wrong.
Not random characters. Wrong like this:
| |
The result was not obvious noise. It returned a different address with the correct format for my network. The value looked valid and would have been easy to miss in a longer list.
So it is a transcriber and not a source, and I stopped treating it as one. The transcription is now marked inline, in the payload, as a transcription and not a measurement, with an instruction to confirm anything important with a real tool call. The warning follows the data, instead of sitting in documentation that nobody reads at 02:00.
It works. In practice the assistant now keeps “what the diagram says” separate from “what is actually there”. It found the rhe9-pxe error itself, pointed out a VM in the screenshot that does not exist, and refused to repeat the VMkernel addresses.
There is a memory lesson here too, and it leads into the third problem. qwen2.5vl:7b is a 6 GB download. With Ollama’s default context it reserves much more than that, and the first time I loaded it, it pushed out the 120B that was already loaded.
I measured both cases again while writing this, on an idle box:
| Context | Resident size | Change on the pool |
|---|---|---|
| Ollama default | 13.5 GB (12.6 GiB) | 15.7 GiB |
num_ctx=8192 | 5.9 GB (5.5 GiB) | 7.5 GiB |
With 8192 both models fit at the same time with room to spare, and inference on real images was about twice as fast as with the default. A smaller context was cheaper and faster. There was no trade-off here. I had simply been paying for context that I did not use.
3. Reserve or borrow
I had the wrong picture of the software on this box, and it took a measurement to see it. I thought NIM was “the NVIDIA layer” and Ollama was “the models”. Two levels of one stack.
That is not correct. NIM is vLLM in a container. Its own /v1/models says so:
| |
They are the same kind of thing. Two LLM servers, same job, one GPU. The difference is when memory is taken, and whether it is given back. I got a clean look at that because Ollama happened to be idle:
| |
No models loaded. No compute. Nine watts. And 42.7 GiB is gone.
My first idea was to explain that with arithmetic. The server reports NIM_GPU_MEM_FRACTION=0.3, and 0.3 × 121.6 = 36.5, so 36.5 plus “about 6 GiB for the OS” gives 42.5 against a measured 42.7. That is within 0.2 GiB. It feels convincing, and it is worth nothing. I built that calculation to end up at a total I already had, so of course it did. Only the total was measured. The rest is a subtraction that I then gave a name to.
The real reading comes from asking which process holds the memory:
| |
That is a named process with a measured allocation. I should also say that my three ways of getting this number do not agree: 35.9 GiB from the stop/start difference, 37.5 GiB from nvidia-smi, and 36.5 GiB from the arithmetic above. That is about 1.5 GiB of spread, and none of them is obviously the correct one.
That is fine, because the spread is not the point. The point is that the number does not change. It is the same when the server handles a hundred requests per hour and when it handles none.
I did check how idle it really was. vLLM has Prometheus counters, so this is exact: 20 requests in 22.8 hours. Less than one per hour, and several of them were my own tests. That is what the ~37 GiB was reserved for.
Neither design is wrong, and this is not criticism of NIM:
- NIM reserves. It takes its share when the container starts, and gives it back when the container stops. That is correct when a model is always serving. The memory is guaranteed, nothing is allocated per request, and latency is predictable.
- Ollama borrows. It allocates when a model is loaded, and frees it when
keep_aliveexpires. That is correct when models come and go.
I have a box that runs all the time, with models that do not. So I was on the wrong side of this. The cost, measured and not estimated:
| Action | Time | Memory |
|---|---|---|
| Stop NIM | 11 s | frees 35.9 GiB |
| Restart NIM until ready | 186 s | takes it back |
| Cold-load the 120B | 19.8 s | 60.1 GiB resident (Ollama /api/ps) |
186 seconds is what decides it. If a restart took 11 seconds like the stop does, this would not be a question. Three minutes is long enough that you want the service up before you need it, and that is the argument for reserving. It is also long enough that I should not pay 36 GiB per hour for 0.88 requests. Those two pull in different directions, and knowing which three minutes you have is the whole decision.
One thing surprised me. open-webui has no depends_on for NIM. With NIM completely stopped, the chat interface still answered in 30 ms. I had assumed that dependency existed. It did not.
4. The tools that agreed with me
The common thread here is not really about models. It is that every one of these failures produced output that was confident, well formatted and believable. Nothing returned an error. That is what made them expensive.
Getting mermaid-cli to run took three errors, and none of them described the actual problem:
- “Input file /data/in.mmd doesn’t exist.” The file existed. The bind mount worked, and I proved that by mounting
/etcinstead and finding/x/hostnameinside the container. The directory was mode 750 and owned by root, and the container runs as uid 1001. A permission problem, reported as a missing file. - “Could not find Chrome.” Every published tag —
latest,11.4.2,10.9.0— ships without a working one. ENOENTfor a binary thatfindhad just located. The image is Alpine, so musl, and puppeteer downloads a Chrome built for glibc. The missing file was not the binary in the message. It was the ELF interpreter that the binary needs.
Each one was found the same way: a control test with the real binary, the real data and the real code path. Not something similar.
One of those controls was worth more to me than the fixes. I tested the mermaid rendering through the API, got a clean diagram with no extra comments, and marked it as done. That test only proved that the prompt worked. The repair code I had just written never ran at all. It took a second test, directly against the deployed module, to show what I thought I had already shown.
The same pattern came back all evening, in tools I would have called reliable:
docker statsreports NIM at 2.8 GiB.nvidia-smireports the same process at 38,442 MiB. On unified memory the cgroup accounting does not see the CUDA allocation. Neither number is wrong. They answer different questions, and only one of them was mine.- The container prints “GB10 may not yet be supported”, and PyTorch’s architecture list has no
sm_121in it. Both look fatal. Neither is. Thecompute_120PTX is compiled at runtime and works. Buttorch.cuda.is_available()returnsTrueeven when the kernels really are missing, so the only way to know is to run an fp16 matmul and check the result. - ComfyUI built without errors and then died at startup. The NGC image has
torchandtorchvisionbut nottorchaudio, and ComfyUI imports it unconditionally. A successful build is not a working program. - A page returned HTTP 200 with 11 kB of valid HTML and rendered completely blank, because the application writes absolute asset paths that get resolved against the wrong origin behind a path prefix proxy. Every check I had was green.
- A check that could never fail. I used
pgrep -f "sd_xl_base_1.0"to wait for a download, and the pattern matchedpgrep’s own arguments. It ran forever without an error. This is the clearest example here: a test that always says yes gives you no information, and it looks exactly like evidence. - A prediction based on the wrong number. With NIM and the 120B both loaded there were 8.3 GiB free, and I said that SDXL, a 6.9 GB checkpoint, would not fit. It did fit. It generated images, and the box peaked at 121.0 of 121.6 GiB, 99.5% full. I had used the file size. With
--lowvramthe weights are streamed, so the working set is not the same as the file. I was right that it was tight, and wrong about the thing I actually said. And 0.6 GiB free is luck, not margin. - A calculation that agreed with its own input. Described above, but it belongs in this list. The 0.3 × 121.6 + 6 arithmetic matched the measured 42.7 GiB within 0.2 because I built it to. A sum that reproduces a total you already have confirms nothing.
And one more, which is why the tables above are explicit about units. The telemetry endpoint calls its fields _gb and returns GiB, while Ollama returns bytes that everyone divides by 10⁹ and calls GB. Use both in the same sentence, and you have overstated the model’s share of the box by about 7%. Worse, “121.6 GB” next to “128 GB unified memory” looks like 6 GB disappeared. Pick one unit, say which one, once.
What I take from this
I had checked all three setups, but some of my checks could not expose the failure I was looking for.
Before I trust a clean result now, I verify that the test can fail in the expected way. A control test proves that a tool works. It does not prove that I gave it the correct data or asked it the correct question.
The image generator, vision model and docker stats all returned clean and believable output. I needed a renderer for exact diagrams, a real API for IP addresses and nvidia-smi for unified GPU memory. Choosing the correct tool mattered more than how convincing the first result looked.