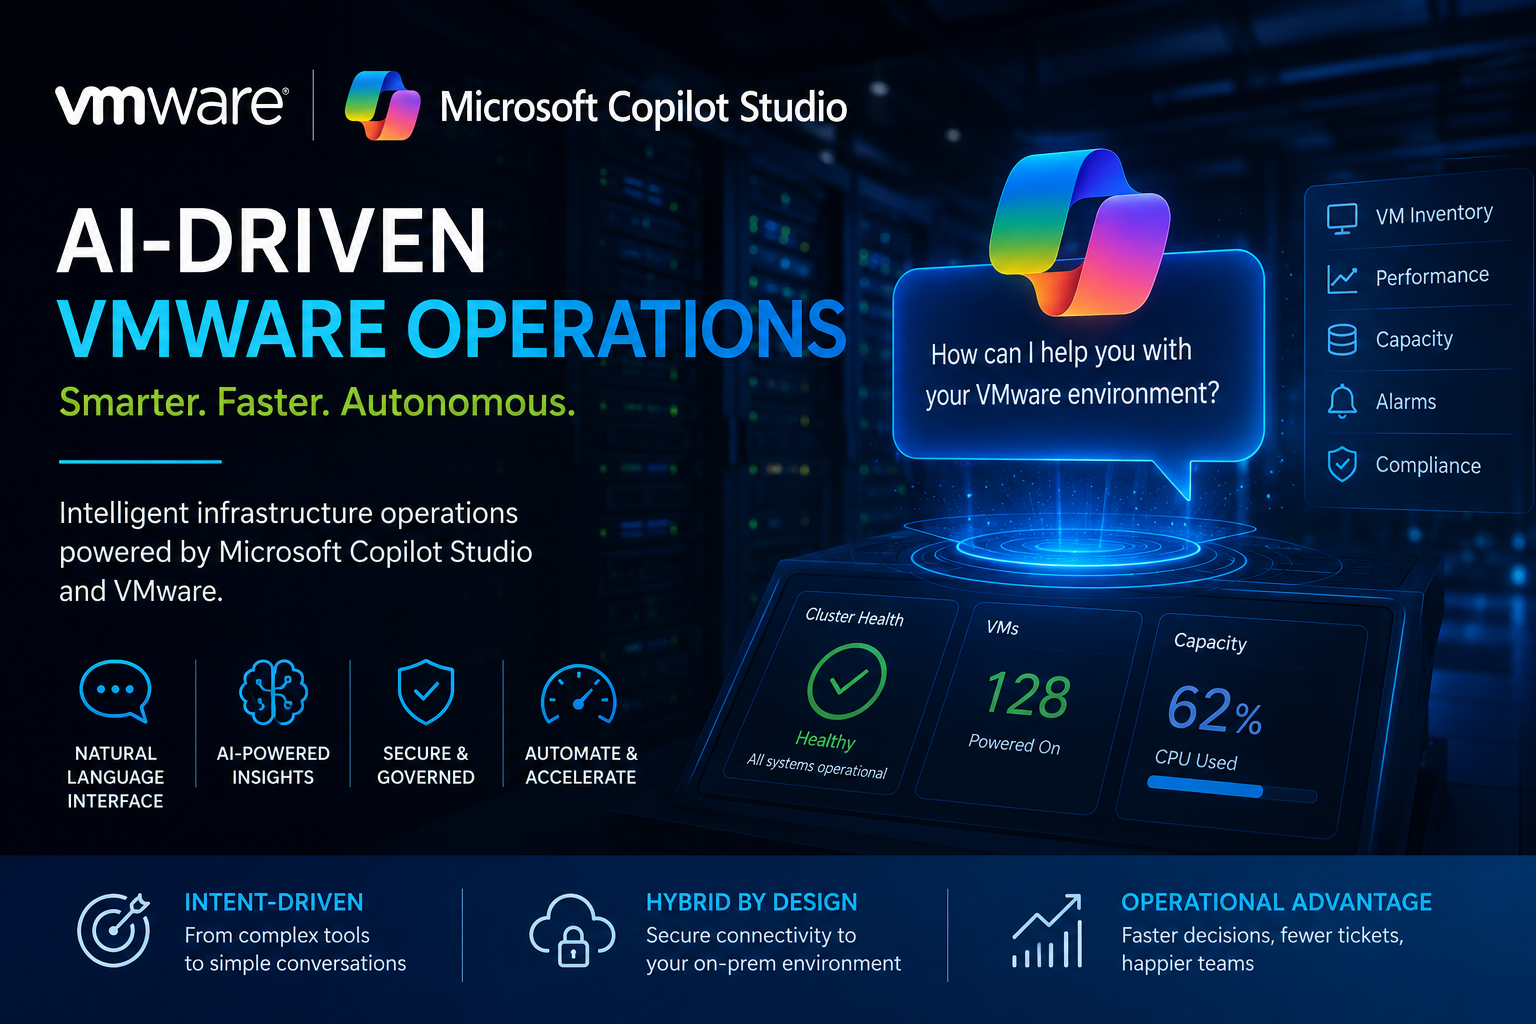
In my VMware lab, a simple question such as “are there any old snapshots?” meant opening three consoles, running PowerCLI scripts, and correlating the results.
I wanted to change that. So I built a working lab integration between Microsoft Copilot Studio and my on-premises vCenter, allowing me to ask infrastructure questions in plain English and get real answers from live data.
This post covers the setup, the problems I hit, and the result.
🔗 Source code: github.com/vidingeb/operational-intelligence
The problem I was trying to solve
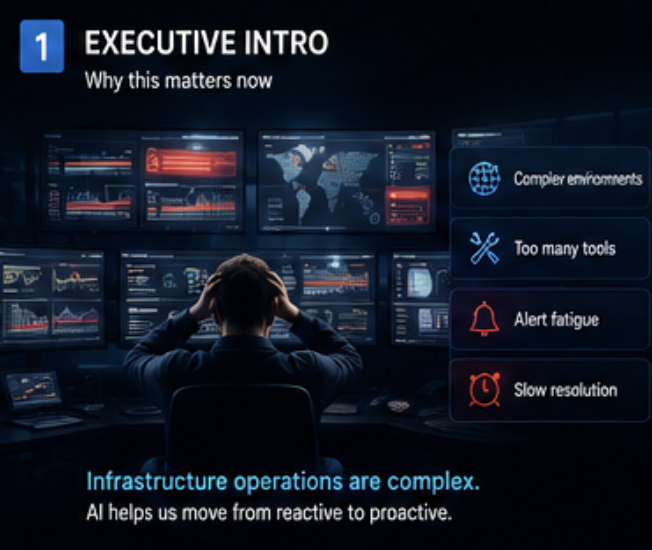
These are typical operational questions:
- Which workloads are running where?
- Is this cluster healthy?
- Are there operational risks right now?
- Do we have old snapshots?
- Are VMware Tools outdated?
- Which hosts need remediation?
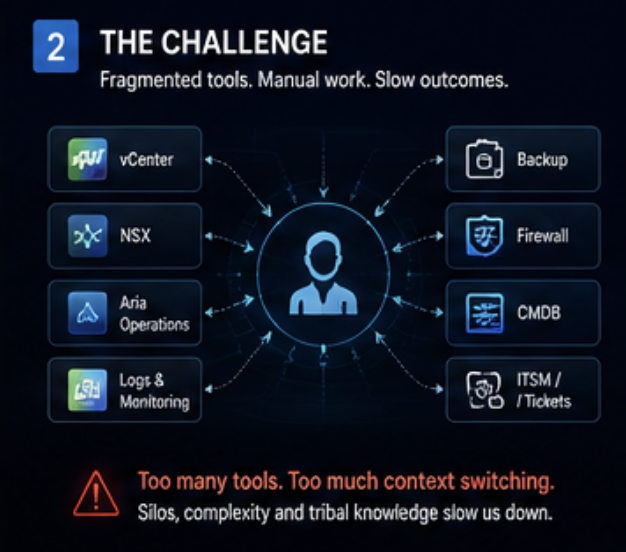
Answering them means navigating the vSphere Client, opening Aria Operations, checking PowerCLI output, or asking someone who knows where the information lives. The process is slow and inconsistent.
I figured: what if I could just ask the infrastructure directly?
The idea: intent-centric operations
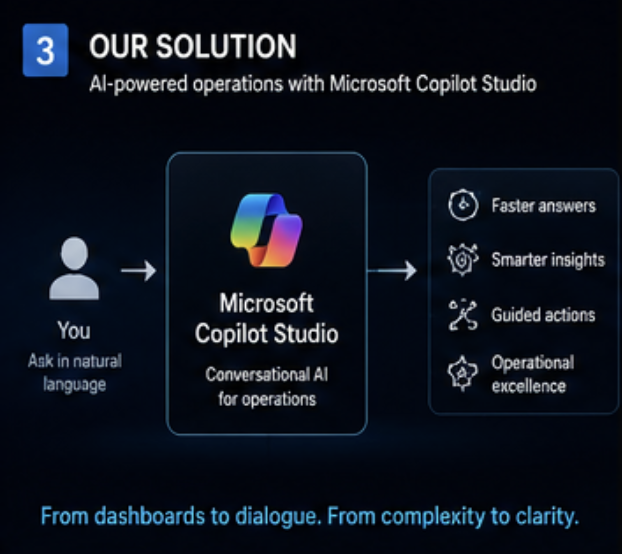
The concept is simple. Instead of me navigating to the right tool and knowing the right clicks or commands, I type what I want to know:
“How many VMs are running on this cluster?”
“Which host is carrying the highest load?”
“Do we have snapshots older than 30 days?”
“Give me a health summary of this environment.”
Copilot Studio selects the API action, retrieves the data, and summarizes the result. Instead of opening the right tool and remembering its clicks or commands, I can state what I need to know.
How the architecture works
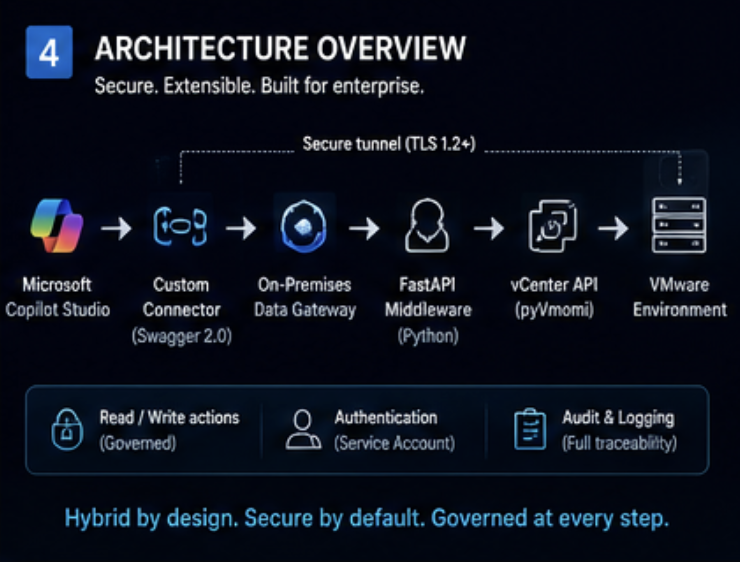
Five components handle the question from the chat interface to the VMware API:
Microsoft Copilot Studio provides the chat interface. It interprets my question, selects an action, and summarizes the API response.
A Custom Connector defines the available actions in a format Copilot Studio understands. It’s essentially an OpenAPI spec that maps my API endpoints to tools the AI can invoke. One important lesson here: Swagger 2.0 was the only format that worked reliably. I initially tried OpenAPI 3.x, but it caused parsing errors and rendering issues in Copilot Studio. Switching to Swagger 2.0 fixed everything immediately.
The On-Premises Data Gateway connects Microsoft’s cloud services to my local lab. It lets the cloud service reach a server on my local network without exposing that server to the internet.
A Python FastAPI service runs locally and acts as the middleware between the connector and VMware. It handles authentication to vCenter, exposes clean REST endpoints, and translates requests into pyVmomi calls.
vCenter via pyVmomi is the source of truth. Every answer comes from the VMware API.
The request flow
When I ask a question, here’s what happens:
| |
The whole round-trip typically takes 2–5 seconds depending on the complexity of the vCenter query.
Building it
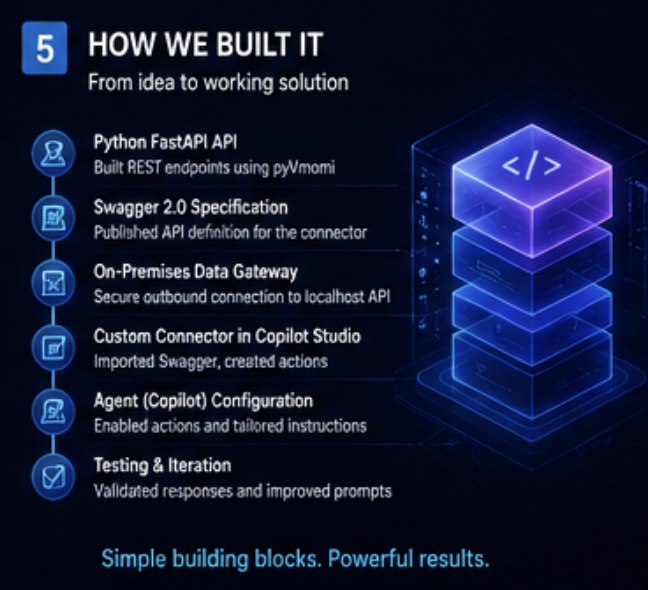
Step 1 — The VMware API layers
I didn’t stop at vCenter. I ended up building three separate API modules, each wrapping a different VMware platform:
vCenter API — The core operational layer using pyVmomi:
| |
VCF Operations API — For platform-level health, capacity, and lifecycle insights from VMware Cloud Foundation’s operations manager. 29 operations covering alerts, symptoms, notifications, compliance, and more.
VCF Network Insight API — For network visibility, flow analysis, and micro-segmentation context. 18 operations covering entity search, NSX segments, Tier-1 routers, alerts, and infrastructure nodes.
In total, I exposed 77 operations across three connectors for Copilot Studio to select from a plain-English question.
The pattern is the same for all three: Python code defines the API calls, you map them in a Swagger spec, and then enable them as tools in your Copilot Studio agent. Each module runs as its own FastAPI service on a separate port (8080, 8081, 8082) with its own connector definition.
I kept the response structures flat and descriptive across all three. The AI summarizes them more reliably than deeply nested objects.
Step 2 — Authentication and credentials
The API services need credentials to talk to vCenter, VCF Operations, and Network Insight. These are stored as environment variables on the server — never hardcoded in the Python files. This keeps secrets out of version control.
On Windows (PowerShell as admin), set them as machine-level variables so they persist across reboots:
| |
After setting these, restart your PowerShell session (or the services) for them to take effect. The Python code reads them at startup via os.getenv().
Step 3 — Testing locally
Before connecting anything to the cloud, I validated every endpoint locally:
| |
This check saved me hours of debugging later. When the gateway failed, I was already 100% sure the local API worked.
Step 4 — Hybrid connectivity
Installing the On-Premises Data Gateway required Azure identity registration, gateway setup, a recovery key, and region selection. Microsoft’s docs cover the process.
Step 5 — The connector (where I hit walls)
I spent most of the debugging time here. Two details mattered:
Host resolution caught me off guard. I initially configured the connector to point to map:8080 (my machine’s hostname). It didn’t work. The fix was using localhost:8080 instead — because the gateway runs on the same machine as my FastAPI service, so from its perspective, it’s connecting locally. This seems obvious in hindsight, but it wasn’t documented clearly anywhere.
The OpenAPI version matters. I started with an OpenAPI 3.x spec because it is the current standard. Copilot Studio’s connector framework had parsing problems: actions did not render correctly, parameters were missing, and some endpoints did not appear. Switching to Swagger 2.0 fixed these problems. Start with Swagger 2.0 for this connector.
Step 6 — Configuring Copilot Studio
Once the connectors were working, I enabled the actions as tools inside a Copilot Studio agent. No topic authoring or rigid conversation flows — just tool definitions and the AI’s ability to match intent to action.
Enabling actions in Copilot Studio is tedious. Each action must be enabled and confirmed separately in the agent configuration. With 77 operations across three connectors, this took a long time. There is no “enable all” button.
The deployment workflow
The architecture diagram does not show how awkward it was to update this setup.
My lab isn’t directly reachable from my workstation. Every time I need to change or add an API endpoint, the workflow looks like this:
- Write or update the Python code locally
- Connect to my lab via VPN
- RDP into my jump server
- RDP from there into my MCP server (which has L2 connectivity to the lab)
- Manually copy the updated Python files to the MCP server
- Restart the FastAPI service
- Update the Swagger spec in my custom connector definition
- Re-test through Copilot Studio
That’s a lot of friction for what should be a simple code change. There’s no CI/CD pipeline here — it’s copy-paste through RDP sessions. If I typo something in the Swagger spec, I don’t find out until I test it through the full chain.
Update: I’ve since solved this with a git-based workflow. The MCP server now has a clone of the project’s GitHub repo, with a scheduled task that pulls every 5 minutes. My new workflow is:
- Edit Python code or Swagger specs on my Mac
git pushto GitHub- The MCP server auto-pulls within 5 minutes — code is deployed
No more RDP chain, no more copy-paste. The Swagger specs live in the same repo under a swagger/ folder, so they’re version-controlled alongside the Python code. When I update an endpoint, I change both files in the same commit — single source of truth.
The only remaining manual step is pasting an updated Swagger spec into the Copilot Studio connector when I add new endpoints. That’s a Power Platform limitation I haven’t automated yet.
What it actually looks like in practice
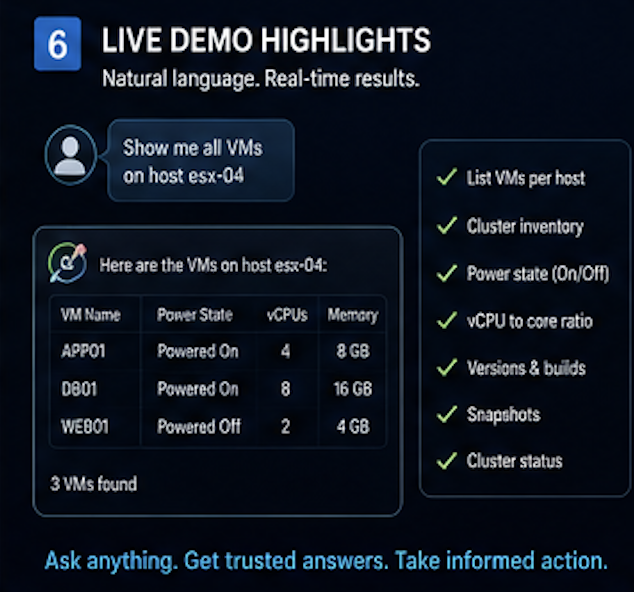
Copilot Studio does more than return the raw API response. It compares the fields and highlights issues in the result.
When I asked for a cluster health summary, it didn’t just list CPU and memory percentages. It noticed that workloads were unevenly distributed across hosts, flagged that some VMs had snapshots over 30 days old, identified outdated VMware Tools versions, and gave me an overall health assessment — all from one conversational question.
It handled inventory queries, capacity analysis, platform state checks, and configuration-hygiene reports. I could get a useful answer without opening each VMware console and correlating the results myself.
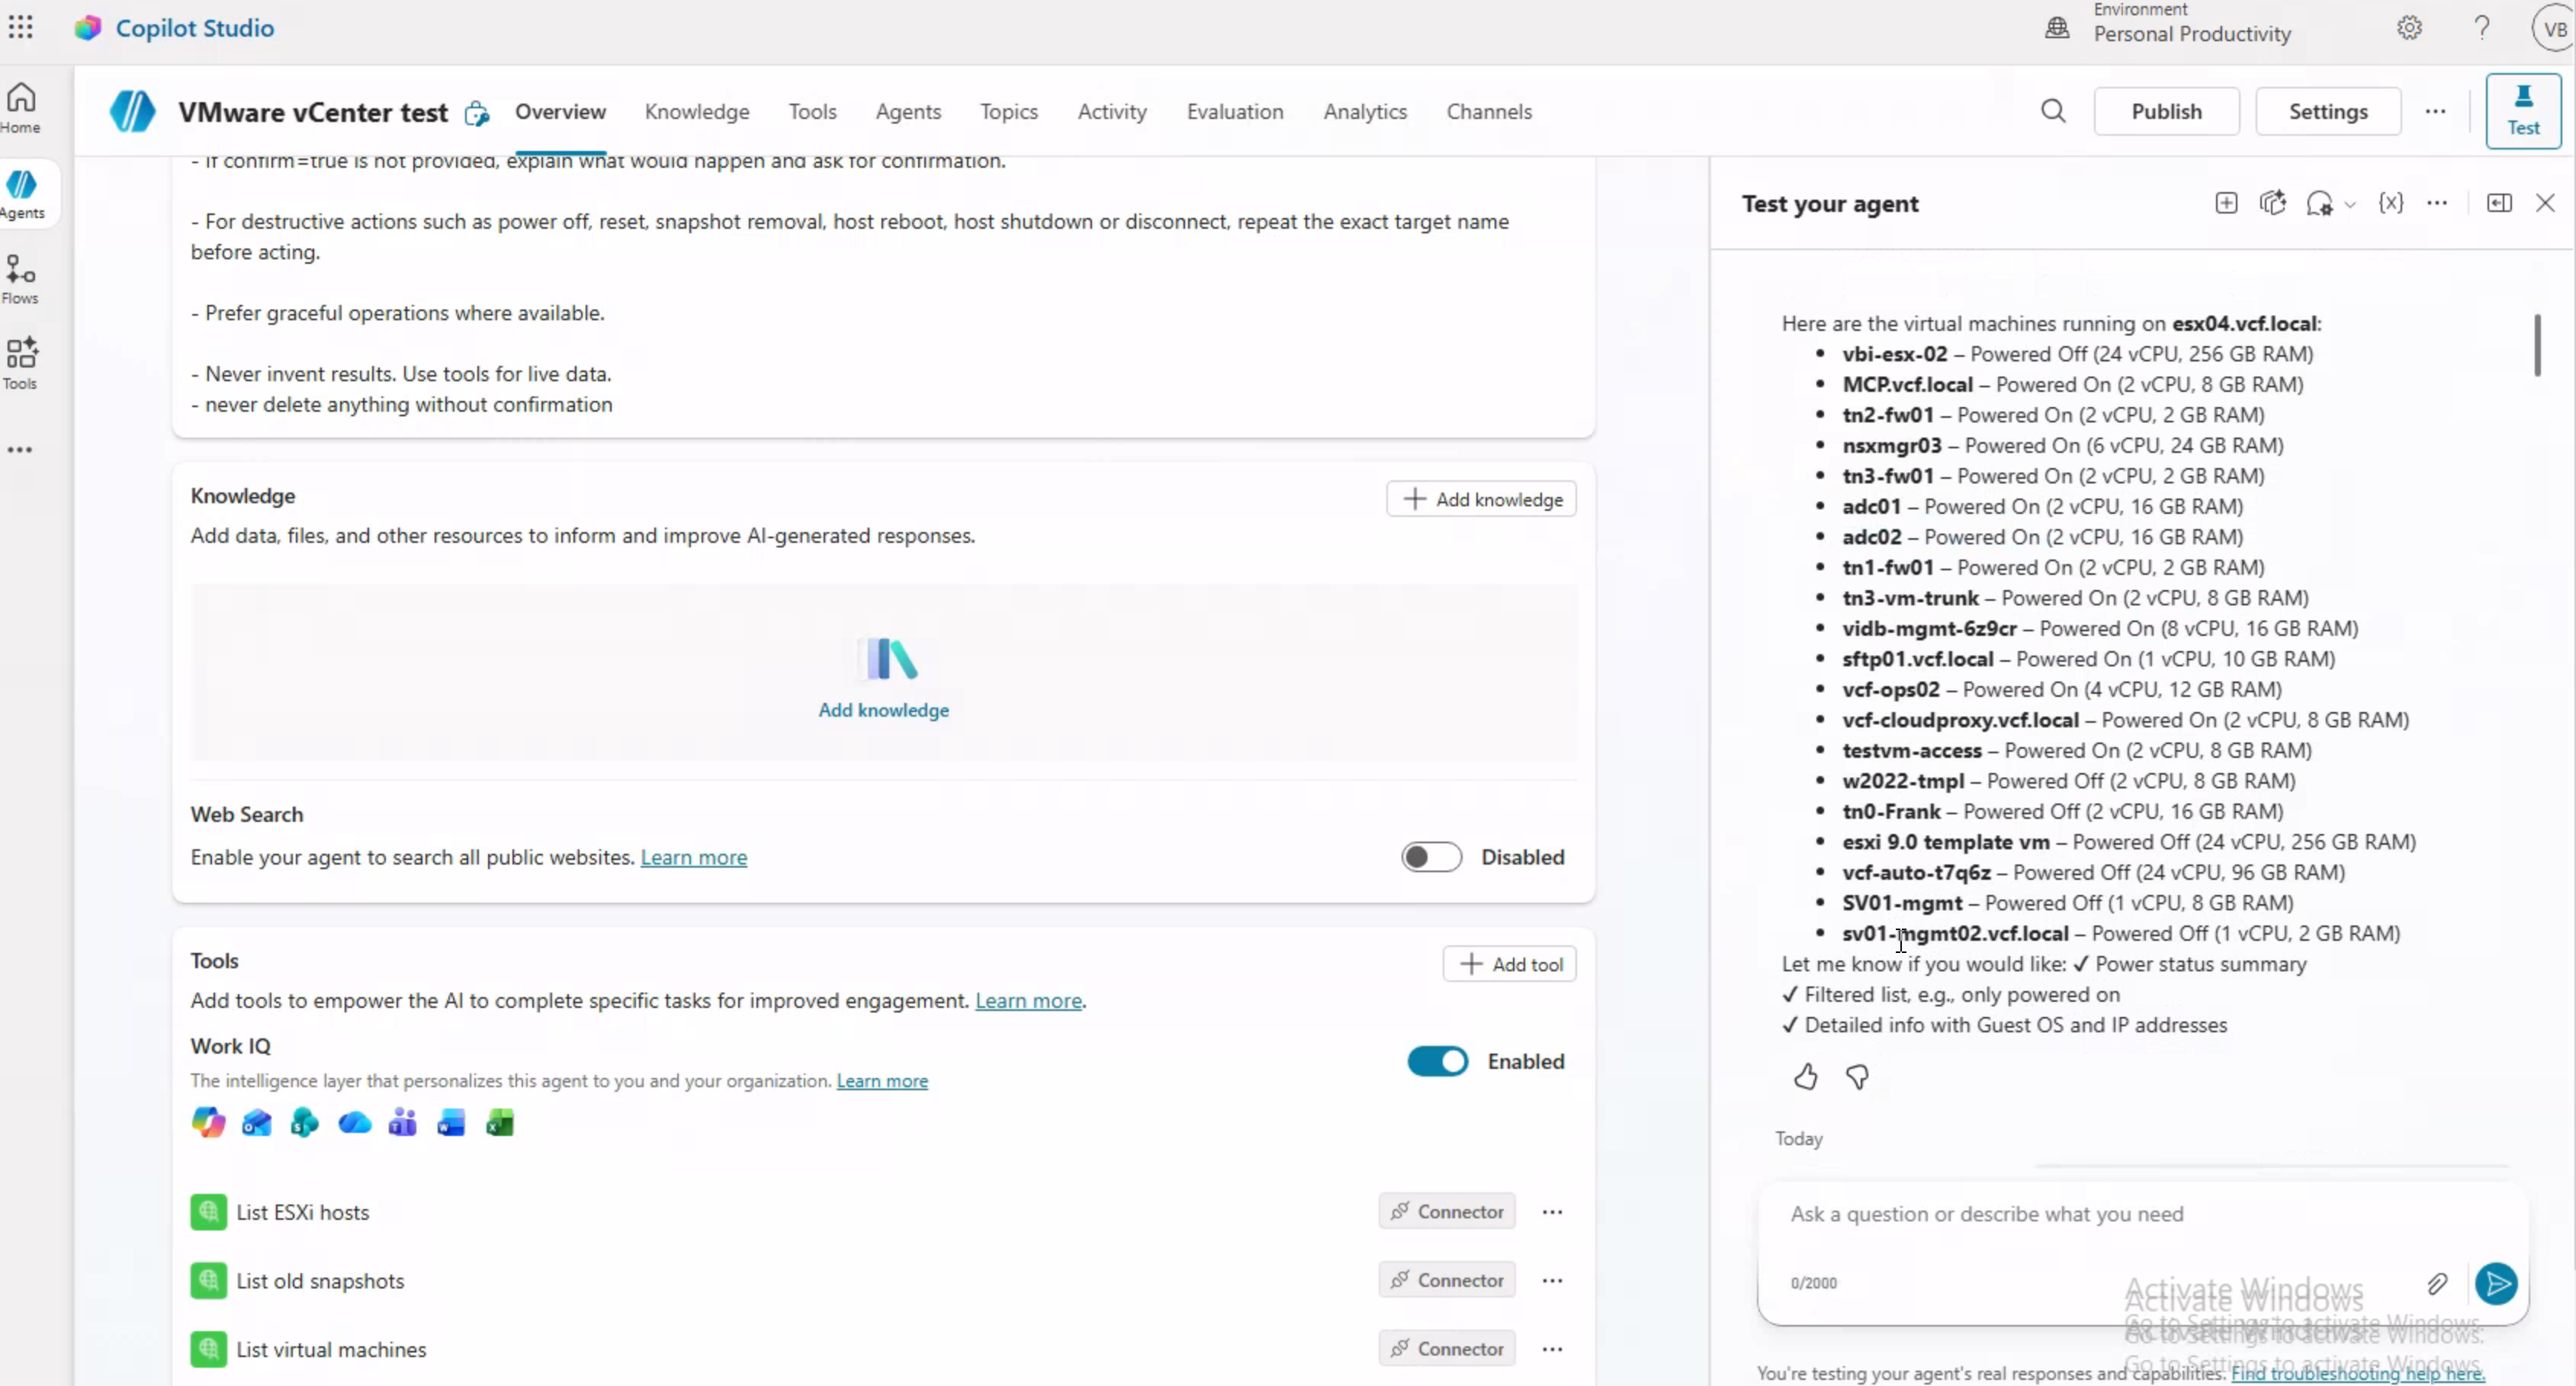
Here’s what it looks like in Copilot Studio with live vCenter data:
From advisory to action
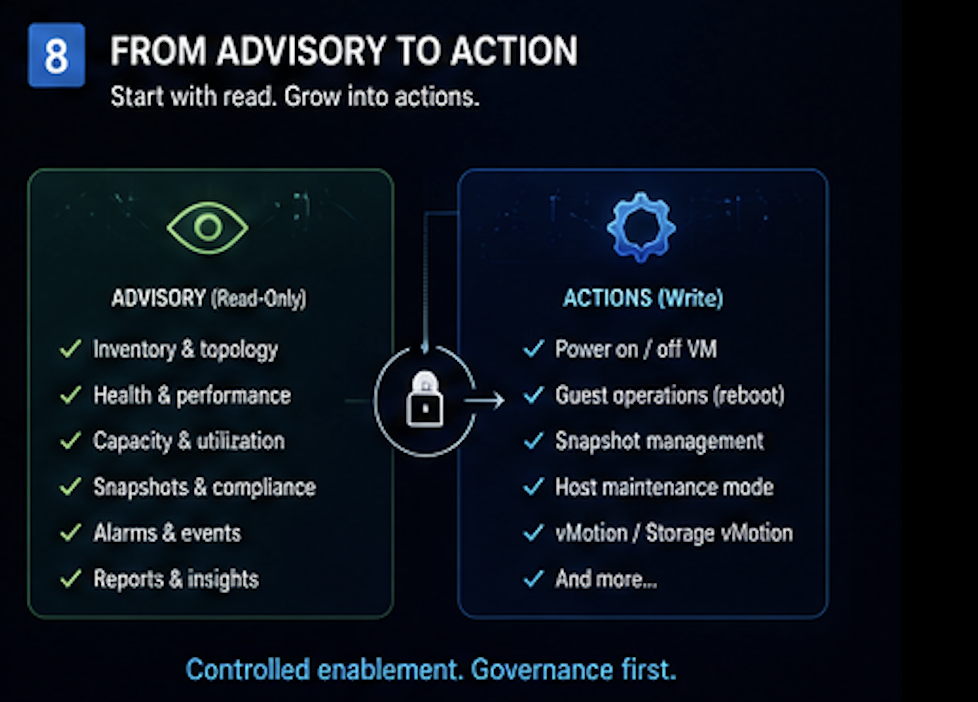
I started read-only by design — no destructive actions, just queries. That was the right approach for building confidence in the system and understanding how the AI interprets intent before giving it any real power.
But since this is my lab and not production, I eventually removed that protection and enabled write operations too. The AI can now take actions like powering VMs on/off, creating and removing snapshots, and triggering vMotion — not just answering questions about the environment.
In production, the design needs explicit controls for:
- Who can trigger actions? Role-based access controls so not every user of the chatbot can reboot a host.
- What requires approval? A
confirm=truepattern where the AI proposes an action and a human explicitly approves before execution. - What’s the blast radius? Distinguishing between low-risk actions (list VMs) and high-risk ones (enter maintenance mode) with different governance levels.
- Audit trail. Every action the AI takes should be logged with who asked, what was done, and when.
The write capabilities I’ve enabled in my lab:
- VM lifecycle: power on/off, reboot, graceful shutdown, snapshot create/delete
- Host operations: enter/exit maintenance mode, reboot, shutdown
- Workload mobility: vMotion, Storage vMotion
- Remediation: remove stale snapshots, upgrade VMware Tools, lifecycle actions
For production, I would start with read-only access. Write operations can be added later behind approval gates.
Other uses
The architecture isn’t specific to vCenter. I’ve already extended it to VCF Operations and Network Insight, and the same pattern — natural language → connector → gateway → local API → infrastructure — works for anything with an API:
More VMware surfaces: VCF / SDDC Manager lifecycle, NSX policy and security, Aria Automation, vSAN Health monitoring.
Broader infrastructure: HPE iLO and Dell iDRAC for hardware management, firmware lifecycle tooling, storage platforms, backup systems.
Enterprise workflows: ServiceNow integration for approval flows, CMDB enrichment from live data, automated incident remediation triggered by conversational triage.
Fully on-premises AI: The next step could be removing the cloud dependency. The FastAPI layer already makes the calls. A local LLM (Llama, Mistral, or similar) could call the same APIs directly, without a gateway, connector, or cloud round-trip. I am testing this for a follow-up project.
Result
This implementation runs against vCenter, VCF Operations, and Network Insight in my lab. I use it to check the environment without opening each console.
The useful change is moving from “know which tool to open and which buttons to click” to asking for the information directly.
The stack is Python, FastAPI, pyVmomi, the On-Premises Data Gateway, and Copilot Studio. Start with read-only endpoints and a Swagger 2.0 spec.